Individual License: $4,950 | Team and Enterprise License Options Available
A Markintel(™) Horizon Report
Diagnose the next decade of imaging growth—today. Marketstrat’s two‑volume study quantifies the US $2.7 B AI‑imaging market and charts its ascent to US $28.4 B by 2032. Seven proprietary frameworks—M³, TEM, ARC, GTM Growth‑Maturity, Platform‑Leverage, Ecosystem Collaboration, and Solution Adoption & Growth—convert thousands of datapoints into executive strategy. Whether you build, invest in, or purchase AI solutions, this report moves you from insights → action in one step.
Why This Study Matters
Radiology faces a triple squeeze: rising scan volumes, stagnant radiologist head‑count, and fast‑evolving reimbursement that now rewards computer‑assisted detection, triage, and quantification. AI is no longer experimental; it is operational. Capital allocation is shifting, yet market signals remain noisy—valuations, attach‑rate assumptions, and regulatory pace vary sharply by geography and modality. Marketstrat’s World Market for AI in Medical Imaging 2025‑2032 cuts through that noise and offers a single, evidence‑weighted source of truth.
Table of Contents – Volume One – Market Analysis & Forecasts
The integration of artificial intelligence (AI) into the realm of medical imaging has shifted from an experimental curiosity to a mainstream imperative. This transition is driven by an intersection of factors:
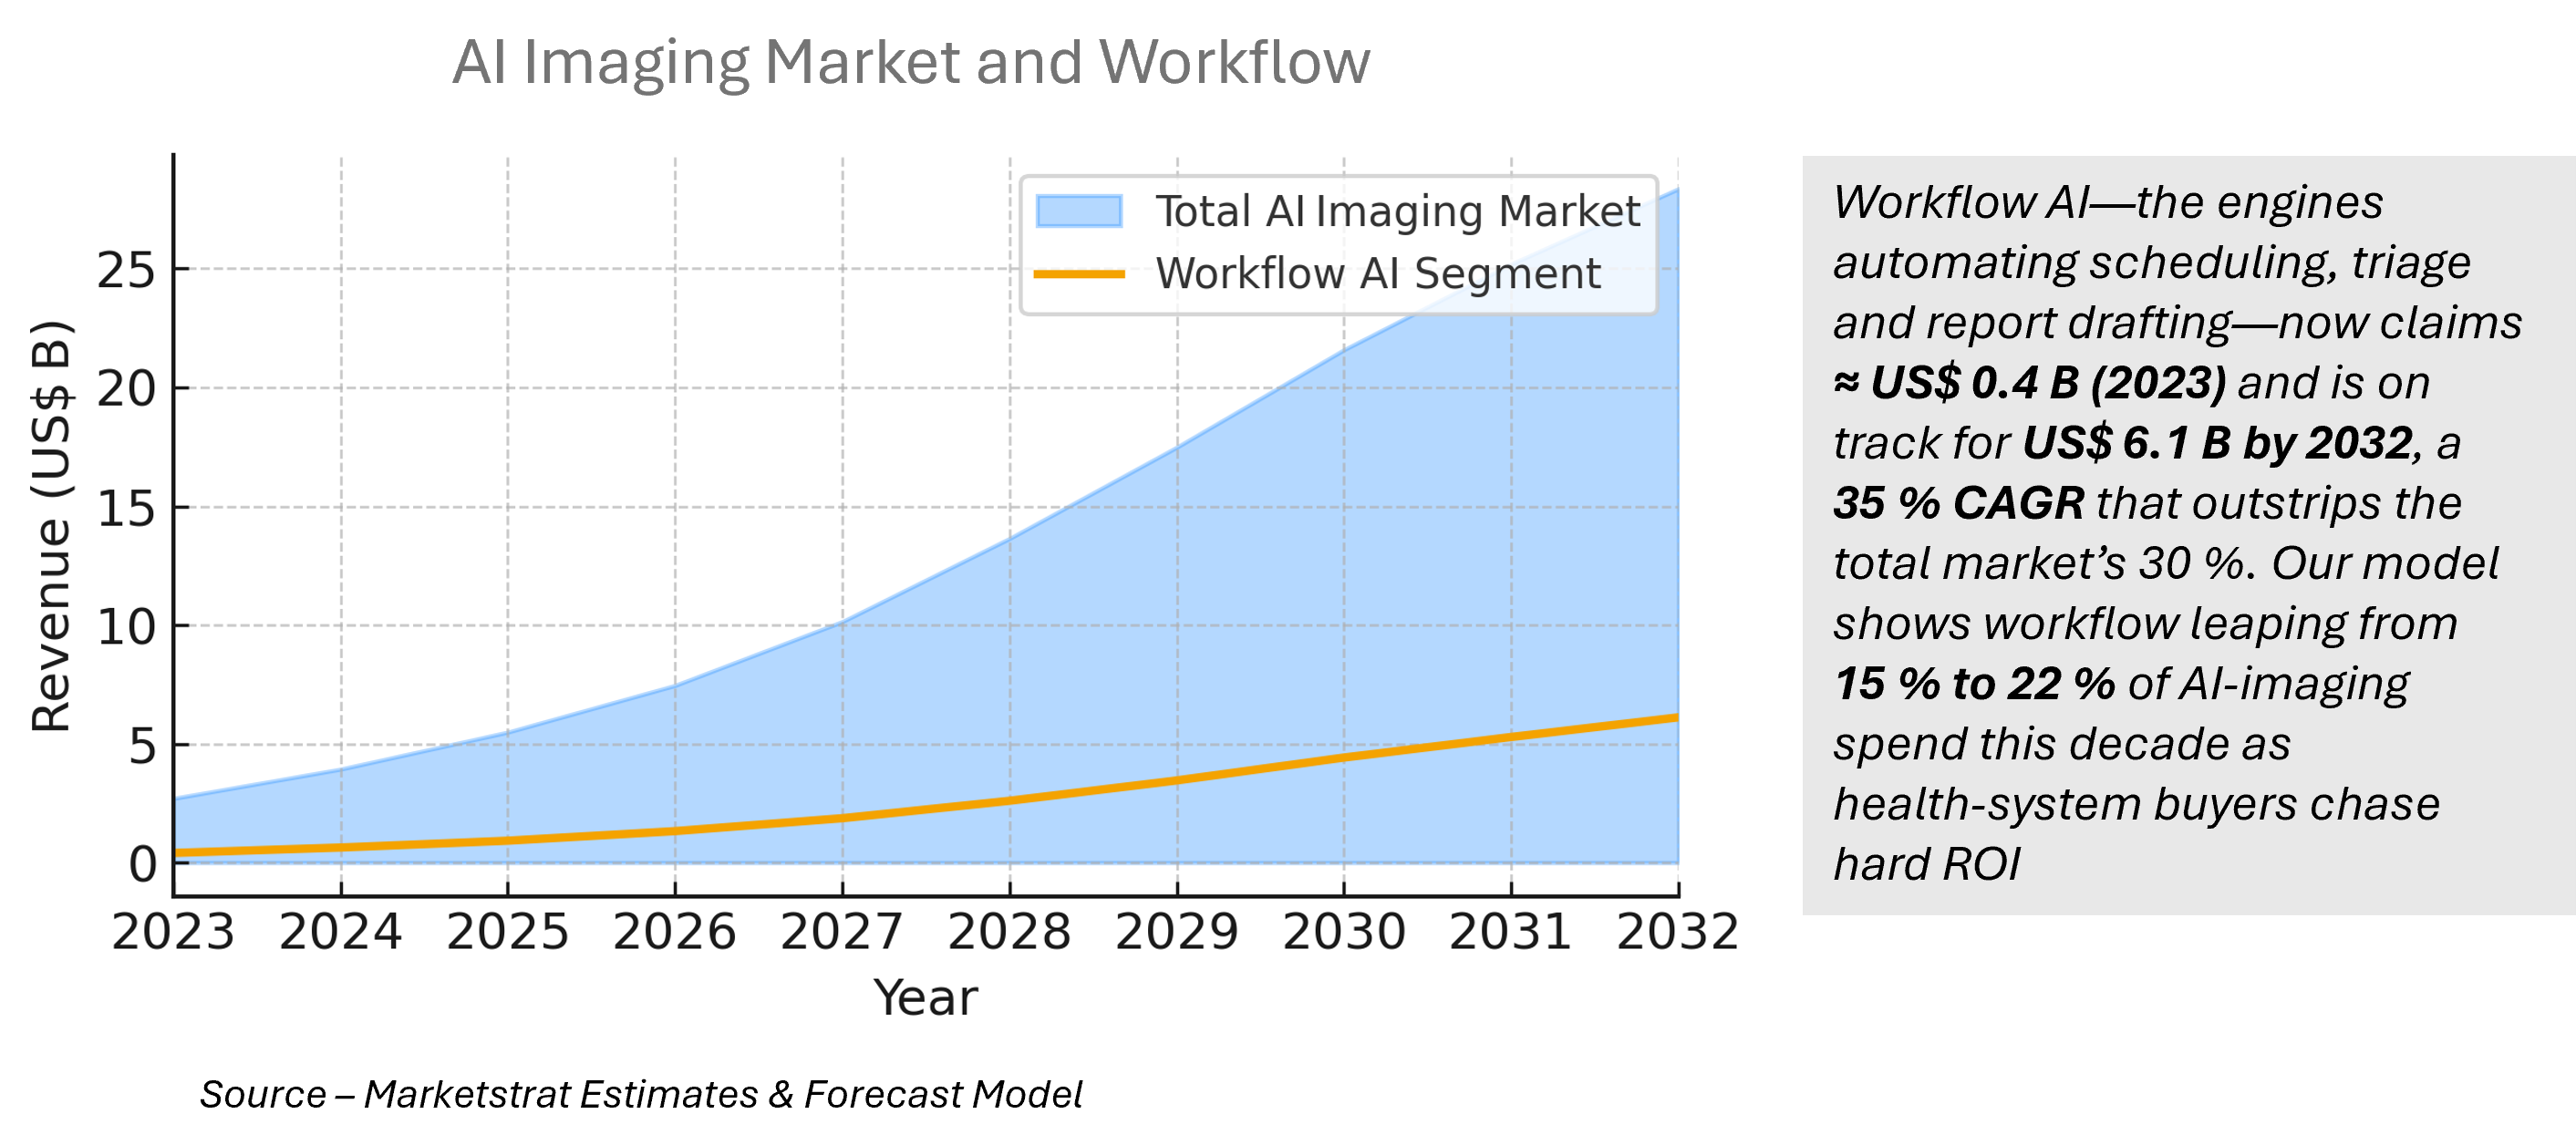
Within this ecosystem, Marketstrat sees AI solutions tackling a multi-faceted set of challenges—ranging from improved diagnostic accuracy and early detection of pathologies to greater efficiency in managing large volumes of scans. The market’s double-digit CAGR forecasts reflect both genuine optimism about AI’s potential and early but tangible clinical successes, particularly in oncology, neurology, and cardiovascular imaging.
Accelerating but uneven
Marketstrat’s analysis shows a near-30 % global CAGR, with the market growing from US $ 2.7 B in 2023 to US $ 28.4 B by 2032. Growth is led by:
Bottom line: Capital availability, regulatory clarity, and enterprise IT readiness explain the regional growth deltas. Vendors that can align commercial models to these realities will capture disproportionate share as the market approaches the US $ 28.4 B mark by 2032.
The AI‑imaging arena is a classic “David‑plus‑Goliath” battlefield. Incumbent modality OEMs—GE HealthCare, Siemens Healthineers, Philips and Canon—are embedding native algorithms into existing scanners and platform stores, leveraging installed bases and service contracts. Pure‑play specialists such as Aidoc, Viz.ai, Annalise.ai and Lunit compete on algorithm depth, evidence volume and cloud‑first deployment, often securing first‑mover reimbursement codes and best‑of‑breed mindshare. A growing cadre of Chinese players—United Imaging, Deepwise, Keya—push price‑performance envelopes and benefit from provincial subsidy programs.
The competitive gap is no longer purely technical; it is commercial. Distribution reach, regulatory cadence and platform stickiness increasingly trump standalone sensitivity metrics. M&A momentum is accelerating: larger OEMs are acquiring niche algorithm firms to plug modality and clinical gaps, while cloud hyperscalers invest in foundation‑model infrastructure. Over the forecast period, we expect platform consolidation to push the market toward three to four ecosystem hubs, with attach‑rate economics favoring vendors that bundle AI with service, cloud storage and analytics dashboards.
Companies analyzed and profiled in this report
4D Medical Ltd.; Accuray Inc.; Adiposs SA; Advanced Micro Devices (AMD); Agfa HealthCare; Aidoc; AIQ Solutions; Airdoc; Annalise.ai; Align X-ray Insights; Artrya; Astute Imaging; Avicenna.ai; AZmed; Baidu; Bayer Radiology; BioMind; Blackford Analysis Ltd.; Bracco Imaging S.p.A.; Brainlab AG; Brainomix Ltd.; BrightHeart.ai; Butterfly Network, Inc. (NYSE: BFLY); CancerCenter.ai; Canon Medical Systems; Carestream; Caristo Diagnostics; CARPL.ai; CathWorks; Cellmatiq GmbH; Cerebra AI; Clarius Mobile Health; Cleerly; Combinostics Oy; ContextFlow GmbH; CoreTechs Labs; CureMetrix; deepc GmbH; DeepHealth (RadNet); DeepMind (Google); DeepSight Technology; DeepTek.ai; DEEPNOID INC; Deepwise; Diagnocat; Digital Diagnostics Inc; EchoNous; Elucid BioImaging; Enlitic; Envisionit Deep AI; Exo Inc; Ferrum Health; Fujifilm; GE Healthcare; Gleamer; Guerbet SA; Heartflow, Inc.; HeartFocus; Heuron; Hologic Inc; Huawei; Huiyihuiying (HY Medical); Hyperfine; icometrix; ImageBiopsy; Imagen Technologies; Incepto Medical SAS; Infervision; JLK Inc; Koios Medical; Konica Minolta; LPIXEL; Lantheus Holdings; Lunit Inc.; Mediaire GmbH; Median Technologies; Medtronic PLC; Merative L.P.; Microsoft; Mindray Ltd; MSKai; Nanox Imaging Ltd.; Nico-Lab B.V.; NIRAMAI; NVIDIA; Olea Medical; Oracle; Oxipit; Perimeter Medical Imaging; Perspectum; Philips Healthcare; Pro Medicus, Ltd.; Qure.AI; Quibim; Radiobiotics; Rad AI; RapidAI; Samsung Healthcare; ScreenPoint Medical; Segami Corporation; Shenzhen Keya Medical Technology Co., Ltd; Shukun Technology / Careverse; Siemens Healthineers; Sirona Medical; Smart Soft Healthcare (CoLumbo); Spectral AI; Stryker Corp; Subtle Medical; Synapsica; Tata Elxsi; Tempus AI; Tencent Holdings; Therapixel; Ultromics; United Imaging; Us2.ai; Vara AI; Vista AI; Viz.ai; VoxelCloud; VUNO; Zimmer Biomet.
Oncology is the fastest‑professionalizing segment in AI‑driven medical imaging, growing from US $ 0.6 B in 2023 to an expected US $ 7.7 B by 2032 (32.7 % CAGR). Growth is propelled by three forces:
North America retains >45 % of global profit through 2032 on the back of NTAP and Category‑I CPT momentum, while APAC overtakes Europe on volume by 2028 amid China’s Class‑II lung‑screening mandate.
Strategic moves now: align product roadmaps with the CPT calendar (breast AI 2026, CT‑FFR lung 2026), publish ≥10 peer‑reviewed real‑world studies, bundle oncology modules into enterprise AI suites, and tier SaaS pricing by GDP‑per‑capita to defend mature‑market ASPs while scaling emerging regions. Players executing on these levers are positioned to own the next inflection point in oncology‑imaging AI.
Marketstrat’s World Market for AI in Medical Imaging 2025‑2032 goes several layers deep. Our dual‑lens methodology reconciles top‑down market sizing with bottom‑up attach‑rate and ASP calculations, all stress‑tested against licensed expert interview transcripts. Seven proprietary frameworks—M³, TEM, ARC, GTM Growth‑Maturity, Platform‑Leverage, Ecosystem Collaboration and Solution Adoption & Growth—translate raw data into decision tools that flag not just where the money is, but how fast it can be captured and at what risk.
The result is a single source of truth for OEM strategists, pure‑play AI vendors, investors and hospital procurement teams who need to quantify TAM, benchmark competitors and de‑risk capital allocation. If your growth plan depends on accurate attach‑rate assumptions, reimbursement scenarios or vendor evidence scoring, this is the report that turns market noise into actionable signal.
Seven proprietary strategy lenses—M³ Matrix, TEM Map, ARC Index, GTM Growth‑Maturity Quadrant, Platform‑Leverage Strip, Ecosystem Collaboration, and Solution Adoption & Growth Matrix—translate complex datasets into board‑ready visuals. Volume 1 delivers the macro picture and forecasts; Volume 2 profiles 120 vendors with side‑by‑side heat‑maps, attach‑rate models, and forward scenarios. Use the insights to benchmark competitors, stress‑test investment theses, or de‑risk purchasing decisions.
| Forecast Period | 2024–2032 |
| Market Size | From $2.7B (2023) to $28.4B (2032) at 29.9% CAGR |
| Pages | ~890 pages (including 750+ visuals & 160 data tables) |
| Companies Profiled | 120+ (OEMs, AI specialists, tech titans) |
| Release Date | Aug 2025 |
| Geographies Covered | N. America, Europe, Asia-Pacific, LATAM, MEA.
North America (US, Canada) | Europe (Germany, France, UK, Italy, Spain, ROE) | APAC (China, Japan, India, S. Korea, Australia, ROAPAC) | LATAM | MEA |
| Custom Region Breakouts | Available upon request (add-on) |
SECTION 1 – EXECUTIVE SUMMARY. 40
Why This Market Matters — the 25-second Read. 40
Global Growth at a Glance. 40
Five Strategy Headlines to Internalize. 41
Where Growth Concentrates – Modality & Clinical Slices. 41
Regional Pulse – Inflection Points & Watchouts. 42
Competitive Heat ‑ the Five Moves to Track. 42
Three-year KPI Outlook (2024 → 2027). 43
Six Board-level Actions for the Next 12 Months. 43
Methodology Summary. 43
SECTION 2 – RESEARCH METHODOLOGY. 44
About the Report. 44
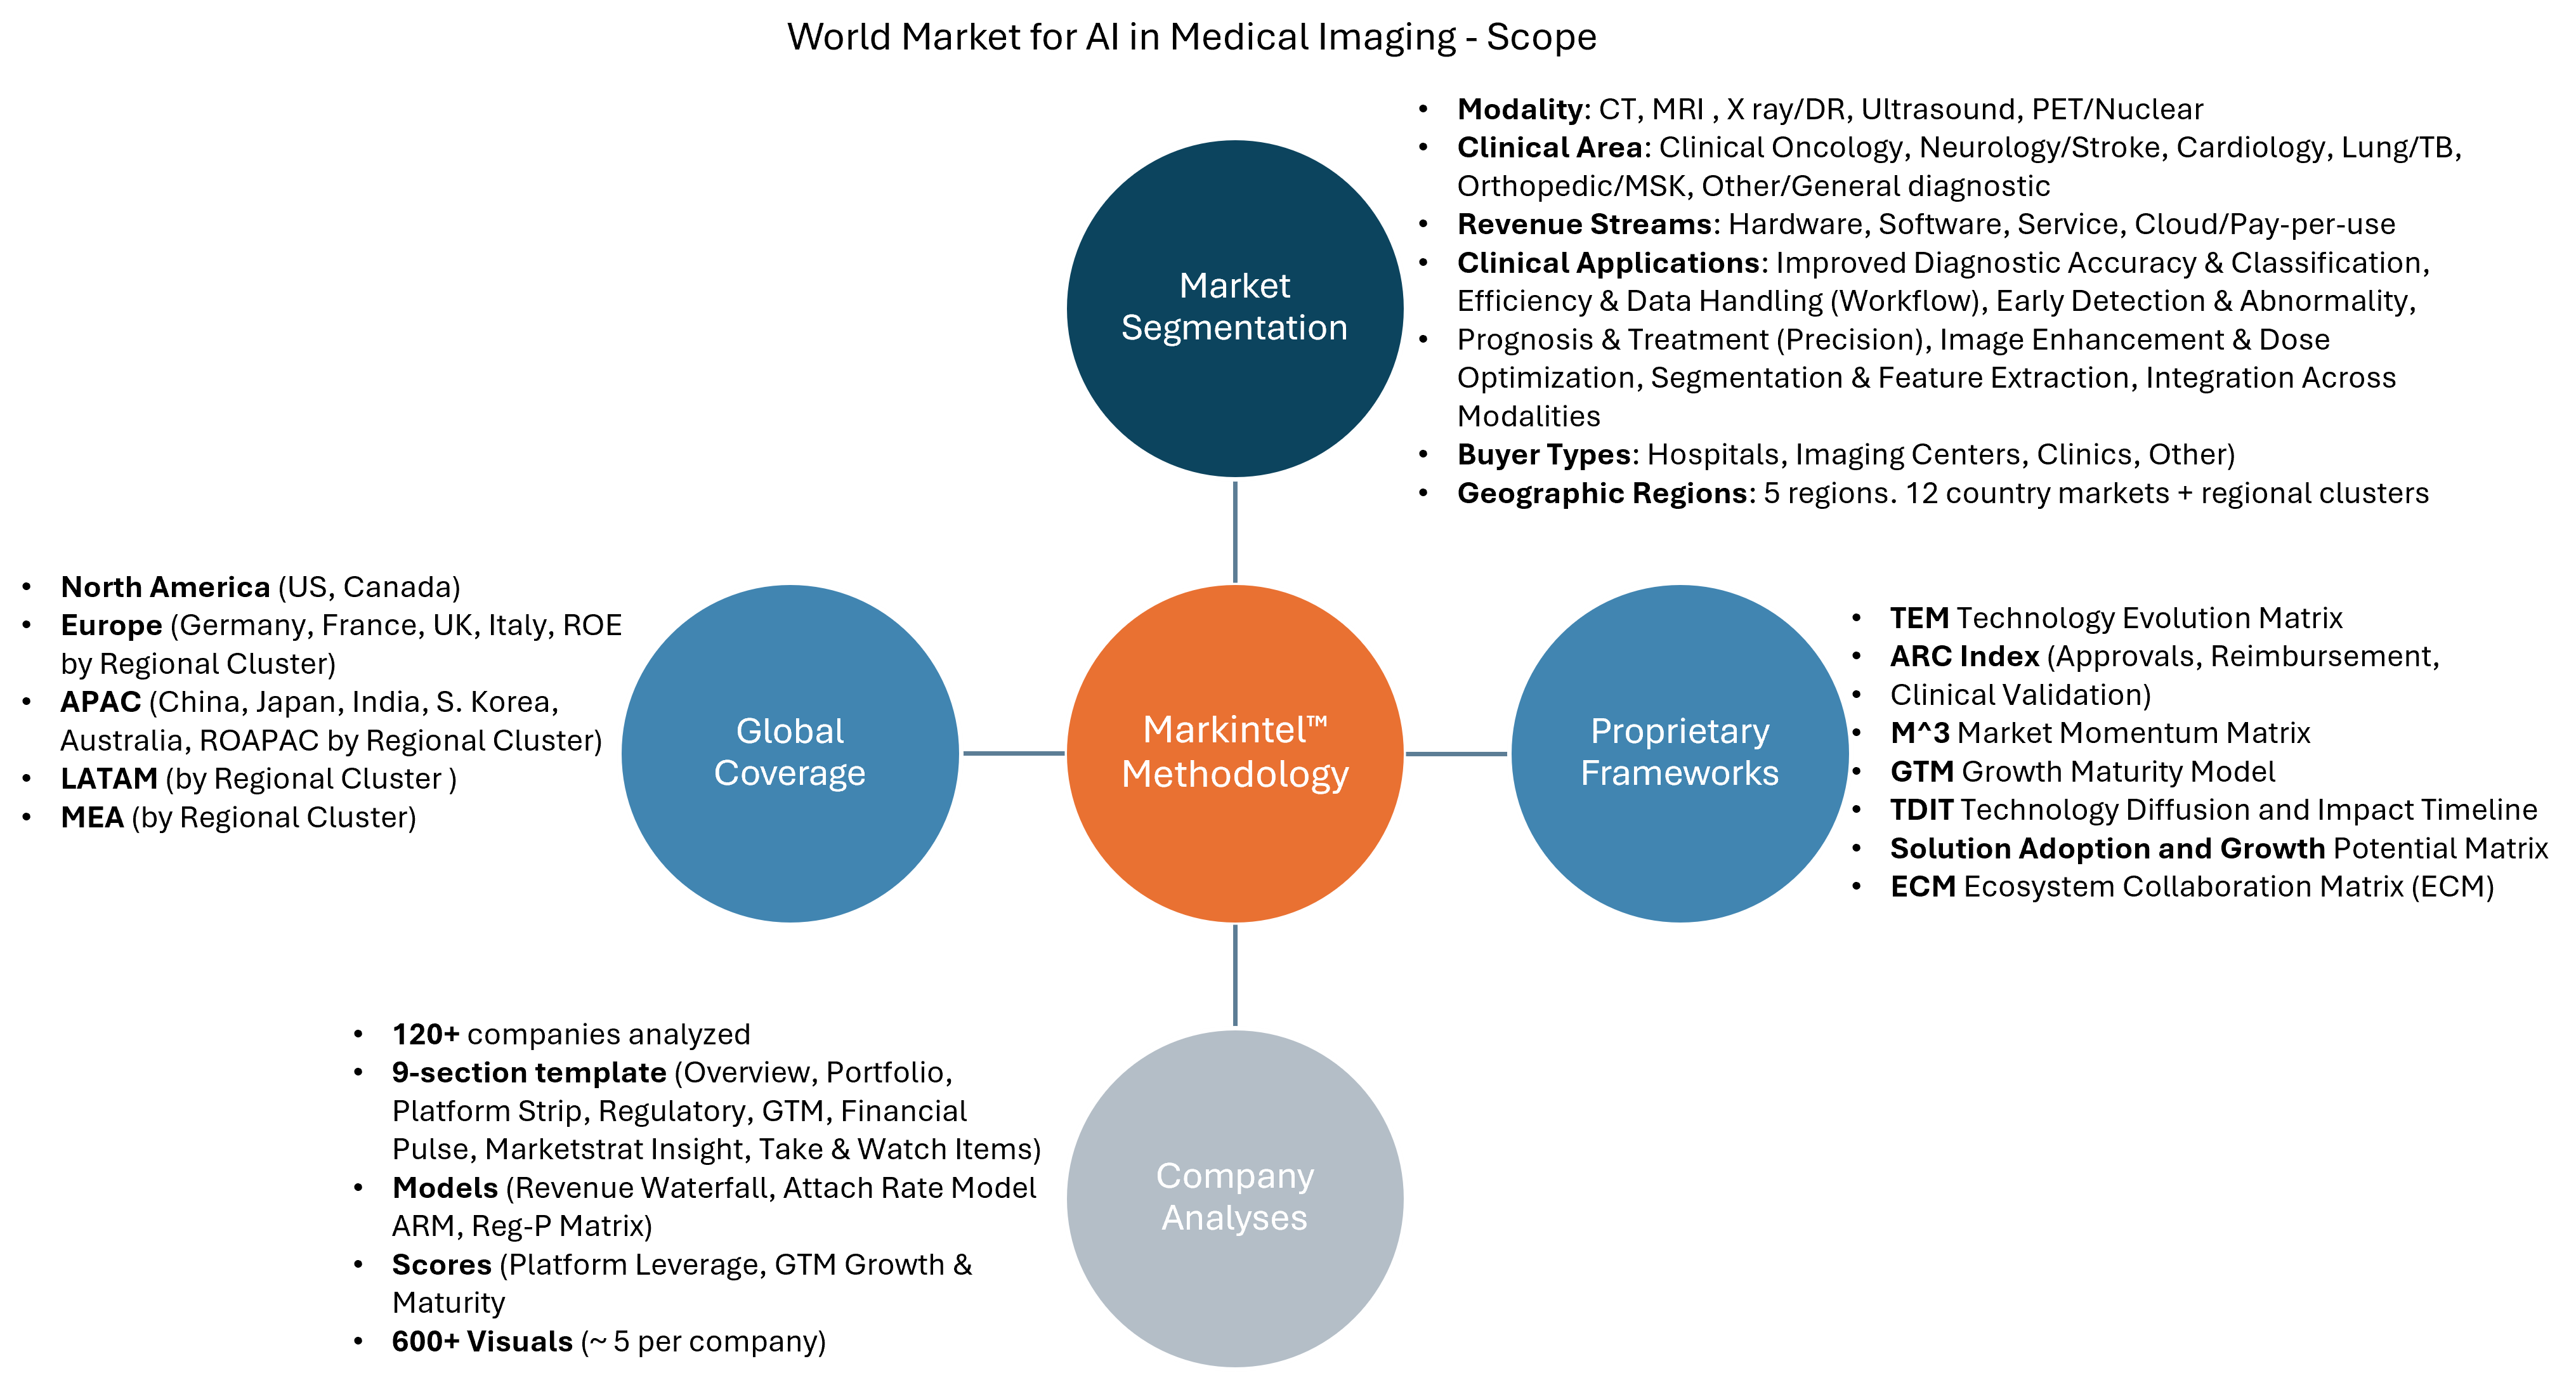
Scope & Segmentation. 44
Marketstrat’s “Insights → Action” Approach. 44
Dual-Lens Architecture. 45
Top-Down Market Funnel 45
Bottom‑up Attach Rate Flow.. 46
Evidence Confidence – Density vs Reliability. 47
Framework Stack – Turning Insight into Action. 48
Quality Assurance Loop. 48
Limitations & Mitigations. 48
Company Briefs Methodology (Vol Two). 48
SECTION 3 – STRATEGIC MARKET ANALYSIS & FRAMEWORKS. 49
Why Read This Chapter?. 49
Outlook (2025–2030). 49
Recommendations by Stakeholder Type. 49
Section Introduction. 50
Global Market & Procedure Volumes: Contextual Overview.. 50
Imaging Procedure Volumes. 51
Core Reference — Annual Procedure Volumes. 52
Market Drivers and Restraints. 52
Top Market Drivers (Ranked). 53
Top Market Restraints (Ranked). 53
World Market Forecast by Region (2023-2032). 54
Regional Growth Pattern. 54
Strategic Implications for Vendors. 54
Markintel M^3 Matrix (Market Momentum Matrix). 55
Portfolio Recommendations. 55
Market Size vs. 2024-32 CAGR. 56
Market Momentum by Modality. 57
Market Momentum by Clinical Segment. 57
Market Phases. 57
Market Sensitivity — Tariffs & FX (2024-26). 58
Markintel Technology Evolution Matrix (TEM). 58
TEM by Geographic Region. 58
TEM by Imaging Modality. 59
TEM by Clinical Application. 59
Markintel TEM Scoring Framework – Methodology Snapshot. 60
Markintel TEM by Region (2025) – Numeric Scorecard. 61
Markintel TDIT (Technology Diffusion and Impact Timeline). 61
TDIT Stage Definitions & Horizon. 62
TDIT Quantitative Impact Tags. 63
Key Inflection Drivers. 63
Potential Roadblocks. 63
Marketstrat Actionable Insights. 63
Markintel Solution Adoption & Growth Matrix – Worldwide. 64
Immediate Strategic Recommendations. 64
Quantification Guide. 65
Illustrative Segment Scores. 65
Quadrant Explanations & Global AI Solution Examples. 65
Marktintel ARC Index (Approvals, Reimbursement, Clinical Validation). 66
Markintel ARC Index by Use Case. 66
Rationale for ARC Index Score by Use Case. 67
Markintel ARC Index Score by Clinical Area. 67
Oncology and Sub-Areas. 67
Neurology and Sub-Areas. 67
Cardiology and Sub-Areas. 68
Respiratory/Pulmonary and Sub-Areas. 68
Orthopedics and Sub-Areas. 68
Regulatory and Compliance Trends. 68
FDA Approvals: Key Details. 68
Global Regulatory Landscape. 69
Potential Shifts. 69
FDA Clearances & Emerging Regulatory Landscapes. 69
Regulatory & Reimbursement Snapshot – Update to Apr 2025. 69
FDA Imaging-AI Clearances Heatmap, 2018 – 2025 YTD.. 70
Reimbursement Timeline Snapshot. 70
FDA Clearances by Modality (cumulative Apr 2025). 71
Reimbursement Timeline Detail 71
Markintel GTM Growth Maturity Matrix – World Market. 72
Competitive Dataset – World Market for AI Imaging. 72
Key Takeaways. 74
Growth & Maturity Highlights (selected). 74
Competitive Landscape and Clusters. 74
SECTION 4 – WORLD MARKET ANALYSIS & FORECAST. 76
Section Overview.. 76
Why Read This Chapter?. 76
Marketstrat Thesis. 76
Regional Growth Picture. 76
World Market Forecast by Region (2023-2032, $ Mill). 77
Strategic Takeaways. 77
Big-5 Regions CAGR Waterfall 78
World Market Analysis by Clinical Area. 79
Clinical Area Summary. 79
Global Forecast by Clinical Area (2023-2032, USD Mill). 79
What the Numbers Mean for Strategists. 79
Caveats & watch-points. 80
Clinical Area Definitions. 80
Oncology Imaging AI Market Worldwide. 82
Market Forecast by Region – Oncology Imaging AI (2023-2032, USD Mill). 82
Oncology Imaging AI: From Niche App to Enterprise Platform.. 82
Regional Growth Snapshot (2023 → 2032). 82
Strategic Implications for Vendors. 83
Market Momentum & Outlook. 83
Markintel GTM Growth Maturity Framework – Oncology AI Worldwide. 83
Competitive Dataset – Oncology AI Imaging. 84
Competitive Context – Oncology AI 84
Strategic Takeaways – Oncology AI 85
Growth & Maturity Highlights (All Vendors). 85
Fast-Mover M&A Targets (Oncology AI). 86
Regulatory Velocity – New FDA Clearances Oncology Imaging AI 86
Modality-Reach Heatmap – Oncology Imaging AI 2024. 87
Procedure Volumes. 87
AI Applications & Adoption Trajectories. 87
Cardiology Imaging AI Market Worldwide. 89
Market Forecast by Region (2023-2032, USD Mill). 89
Cardiology AI – Why Adoption is Breaking Out. 89
Regional Growth Snapshot. 89
Strategic Implications. 89
Markintel GTM Growth Maturity Framework – Cardiology Imaging AI Worldwide. 90
Competitive Dataset – Cardiology AI-Imaging. 90
Competitive Context – Cardiology AI 91
Strategic Takeaways. 92
Growth & Maturity Highlights – Cardiology Imaging AI 92
M&A Watch — Fast-Moving Rising Stars. 93
Regulatory Velocity – New Cardiology AI Imaging Clearances (Mar 2024 to June 2025). 93
Modality-Reach Heatmap – Cardiology AI 2024. 94
Procedure Volumes. 94
AI Applications & Adoption. 94
Future Directions. 94
Neurology Imaging AI Market Worldwide. 96
Market Forecast by Region (2023-2032, USD Mill). 96
Why Adoption is Moving Beyond Stroke Triage. 96
Regional Growth Snapshot. 96
Strategic Implications. 96
Markintel GTM Growth Maturity Framework – Neurology Imaging AI Worldwide. 97
Competitive Dataset – Neurology AI-Imaging. 97
Competitive Context — Neurology AI 98
Strategic Takeaways. 98
Growth and Maturity Highlights – Neurology AI Imaging. 99
Fast-Mover M&A Watch-List — Neurology AI 99
Regulatory Velocity – New Neuro-AI Clearances – Neurology AI Imaging (Mar ’24 – Jun ’25). 100
Modality Reach Heat-Map – Neurology AI 2024. 100
Procedure Volumes – Neurology Imaging AI 101
AI Use-Cases. 101
Market Evolution. 101
Respiratory Imaging AI Market Worldwide. 102
Market Forecasts by Region (2023 – 2032, USD Mill). 102
What Ignited the 2024 Breakout. 102
Regional Growth Snapshot. 102
Strategic Implications. 102
Markintel GTM Growth Maturity Framework – Respiratory Imaging AI – World. 103
Competitive Dataset – Respiratory AI Imaging. 103
Competitive Context — Respiratory AI 104
Strategic Takeaways. 104
Growth and Maturity Highlights. 105
Fast-Mover M&A Watchlist. 105
Regulatory Velocity – New Respiratory-AI Clearances (Mar ’24 – Jun ’25). 106
Modality Reach Heat-Map – Respiratory Imaging AI Worldwide – 2024. 106
Orthopedic/MSK Imaging AI Market Worldwide. 107
Market Forecasts by Region (2023 – 2032, USD Mill). 107
What is Driving Acceleration. 107
Regional Growth Snapshot. 107
Strategic Implications. 108
Markintel GTM Growth Maturity Framework – Orthopedic/MSK Imaging AI – World. 108
Competitive Dataset – Orthopedic Imaging AI 108
Competitive Context — MSK (Orthopedic) AI 109
Strategic Takeaways. 110
Growth and Maturity Highlights. 110
Fast-Mover M&A Watchlist. 110
Procedure Volumes. 110
AI Adoption & Key Applications. 111
Regulatory Velocity – Orthopedic (MSK) Imaging AI Worldwide – (Mar ’24 – Jun ’25). 111
Use Cases. 111
AI Solutions. 111
Modality Reach Heat-Map – Orthopedic (MSK) AI 112
Other Clinical Areas Imaging AI Market Worldwide. 113
Market Forecasts by Region (2023 – 2032, USD Mill). 113
Segment Overview & Characteristics. 113
Regional Snapshot. 114
Strategic Takeaways. 114
Revenue Breakdown — “Other” Clinical Areas Worldwide (2024). 114
Sub-Areas, Use Cases, Vendors. 114
Reimbursement Readiness Heatmap. 115
Depth vs Breadth Snapshot. 115
Regulatory Velocity – Other Clinical Areas Imaging AI (Mar ’24 – Jun ’25). 116
Strategic Takeaways. 117
M&A Watchlist. 117
World Market Analysis by Imaging Modality. 118
Modality Outlook: Where AI Value Pools Shift Through 2032. 118
Highlights. 118
Global Forecast by Modality (2023-2032, USD Mill). 118
Market Math & Diffusion Pattern. 118
Strategic Takeaways for Vendors. 118
Modality Definitions. 119
CT Modality Imaging AI Market Worldwide. 120
Market Forecast by Region – CT Imaging AI (2023 – 2032, USD Mill). 120
Regional mix in 2032. 120
Adoption Accelerators. 120
Strategic implications for vendors. 120
Markintel GTM Growth and Maturity Matrix – CT Imaging AI – World. 121
Competitive Dataset – CT AI-Imaging. 121
Growth and Maturity Highlights – CT AI-Imaging Companies. 122
Competitive Context – CT modality AI 123
Strategic Takeaways for 2024-2027. 123
M&A Watchlist – Global CT AI 124
Regulatory Velocity – CT-Specific Clearances. 124
Attach-Rate by Region (CT only, 2024). 125
Revenue Split (Factory vs Retrofit) by Region – CT. 126
Procedure Volumes & Applications. 126
MRI Modality Imaging AI Market Worldwide. 128
Market Forecast by Region – MRI Imaging AI (2023 – 2032, USD Mill). 128
Regional Mix in 2032. 128
Adoption Accelerators. 128
Strategic Implications. 128
Markintel GTM Growth and Maturity Matrix – MRI Imaging AI – World. 129
Competitive Dataset – MRI AI-Imaging. 129
Growth and Maturity Highlights – MRI AI-Imaging Companies. 130
Competitive Context – MRI AI Modality. 131
Strategic Takeaways for 2024 – 2027. 131
M&A Watchlist – Global MRI AI 132
Regulatory Velocity (MRI-AI Clearances). 132
Attach-Rate by Region – MRI 133
Factory vs Retrofit Revenue Split (MRI, 2024). 133
Procedure Volumes & Applications. 134
X-ray Modality Imaging AI Market Worldwide. 135
Market Forecast by Region – X-ray Imaging AI (2023-2032, USD Mill). 135
Regional Split – 2032. 135
Adoption Accelerators. 135
Strategic implications. 135
Markintel GTM Growth and Maturity Matrix – X-ray Imaging AI – World. 136
Competitive Dataset. 136
Growth and Maturity Highlights – X-ray AI-Imaging Companies. 137
Competitive Context — X-ray Modality AI 138
Strategic Takeaways 2024-27. 139
M&A Watchlist – Global X-ray-AI 139
Regulatory Velocity – X-ray AI 139
Attach-Rate by Region (X-ray, 2024). 140
Factory vs Retrofit Revenue Split (X-ray, 2024). 141
Market & Procedure Volumes. 141
Ultrasound Modality Imaging AI Market Worldwide. 142
Market Forecast by Region – Ultrasound Imaging AI (2023-2032, USD Mill). 142
Regional Split – 2032. 142
Adoption Accelerators. 142
Strategic Market Implications. 142
Markintel GTM Growth and Maturity Matrix – Ultrasound AI – World. 143
Competitive Dataset – FY-2024 Ultrasound AI-Imaging (Worldwide). 143
Growth & Maturity Highlights – Ultrasound AI 144
Competitive Context – Ultrasound AI 145
Strategic Takeaways 2024-2027. 145
AI M&A Watchlist – Global Ultrasound. 145
Regulatory Velocity – Ultrasound AI (Mar-23 → Mar-24). 146
Attach-Rate by Region (Ultrasound). 146
Factory vs Retrofit Revenue Split (Ultrasound). 147
Market & Procedure Volumes. 147
Nuclear/PET Modality Imaging AI Market Worldwide. 148
Market Forecast by Region (2023-2032, USD Mill). 148
Regional Split – 2032. 148
Adoption Accelerators. 148
Strategic Market Implications. 148
Markintel GTM Growth and Maturity Matrix – Nuclear/PET imaging AI – World. 149
Competitive Dataset – Nuclear/PET AI-Imaging. 149
Growth & Maturity Highlights – Nuclear / PET AI 150
Competitive Context – Nuclear/PET AI 150
Strategic Takeaways. 151
M&A Watchlist – Nuclear/PET Imaging. 151
Market & Procedure Volumes. 151
World Market Analysis by Revenue Stream.. 152
Forecast by Revenue Stream (2023-2032, USD Mill). 152
Revenue-Stream Dynamics. 152
Regional Color. 153
Strategic Takeaways. 153
Revenue Stream Segments. 153
World Market Analysis by Clinical Application. 155
Forecast by Clinical Application (2023-2032, USD Mill). 155
Functional Value Pools. 155
Regional Color. 156
Strategic Takeaways. 156
Use-Case/Workflow Segmentation. 156
AI Clinical Solutions. 157
World Market Analysis by End-Use Organization. 159
Forecast by End-Use Organization (2023-2032, $US Mill). 159
Buyer Mix Shift. 159
Regional Color. 160
Strategic Implications. 160
End-Use Org Definitions. 160
World Market Analysis by AI Technology. 162
Forecast by AI Technology (2023-2032, $US Mill). 162
Technology Mix. 162
Regional Color. 163
Strategic Takeaways. 163
AI Technology Definitions and Applications. 163
Deep Learning. 163
Computer Vision (Classical). 164
Machine Learning (Traditional). 165
Natural Language Processing (NLP). 165
Robotics. 166
Expert Systems. 167
Summary Comparison of AI Technologies. 168
Key Takeaways. 168
SECTION 5 – REGIONAL MARKET ANALYSIS & FORECAST. 169
What’s in This Section?. 169
Why Read This Section?. 169
Market Summary. 170
Market Size & Drivers. 170
Latest Trends. 170
Strategic Outlook. 170
Competitive Environment. 170
New Focus Areas. 170
North American Market Estimates & Forecasts (2023-2032). 171
AI Imaging Market by Country – North America. 171
What’s Driving the Numbers. 171
Implications. 171
Markintel GTM Growth and Maturity Matrix – North America. 172
Competitive Dataset – North America. 172
Competitive Context — North America AI-Imaging 2024. 173
Strategic Takeaways. 173
Growth & Maturity Highlights – North America. 174
M&A Watchlist — North America Rising Stars. 175
Regulatory Velocity – North America. 175
Source: Marketstrat Analysis of Public Data. 175
OEM AI Attach-Rate by Modality. 175
Source: Marketstrat Analysis. 176
Attach Rate Trends – North America. 176
Factory vs Retrofit – North America. 177
Market Summary – United States. 178
Key Market Dynamics. 178
Strategic Takeaways. 178
Top 3 Recommendations. 178
Market Overview – United States. 179
Demographics & Epidemiology. 179
Macro‑economics & Health Spending. 179
Imaging Volume & Installed Base. 179
Regulatory & Reimbursement Snapshot. 179
Healthcare Delivery & Practice Patterns. 180
AI Market Dynamics (Imaging). 180
Competitive Landscape. 180
Takeaways for Vendors. 180
US Market by Clinical Area. 181
Forecast by Clinical Area (2023-2032, USD Mill). 181
U.S. AI-Imaging Outlook by Clinical Area (2023 → 2032). 181
Key Dynamics to Watch. 181
Implications for Vendors. 182
US Market by Imaging Modality. 182
Forecast by Modality (2023-2032, USD Mill). 182
U.S. Modality Outlook: Who Grows, Who Overtakes. 182
Key Takeaways. 183
US Market by Revenue Stream.. 183
Forecast by Revenue Stream (2023-2032, USD Mill). 183
U.S. Revenue Stream Shift: From Capital Boxes to Recurring Bytes. 183
What’s Driving the Mix Change. 183
Implications for Vendors. 184
US Market by Clinical Application. 184
Forecast by Clinical Application (2023-2032, USD Mill). 184
Outlook by Clinical Application. 184
Highlights. 185
Implications. 185
US Market by End-Use Organization. 185
Forecast by End-Use Organization (2023-2032, USD Mill). 185
Who Buys AI—and How That Mix Shifts Through 2032. 186
What’s Behind the Shift. 186
Strategic Implications for Vendors. 186
US Market by AI Technology. 187
Forecast by AI Technology (2023-2032, USD Mill). 187
Outlook by Core Technology (2023-2032). 187
Markintel Growth Maturity Matrix – US & Canada. 188
Competitive Dataset – United States. 188
Competitive Context — U.S./North America. 189
What to Watch Next. 189
Markintel Solution Adoption & Growth Matrix – US & Canada. 190
Scorecard — Solution Adoption & Growth Matrix (U.S. & Canada). 190
Strategic Implications for Stakeholders. 191
Markintel Ecosystem Collaboration Matrix – US & Canada. 191
Who to Partner with and How Deep?. 192
What Succeess Looks Like in Each Quadrant. 192
Stratregic Guidance. 192
GTM at a Glance – United States. 193
Channel & Pricing Matrix. 193
GTM Readiness Radar – US. 193
Customer Tier Potential – US. 194
GTM Timeline (2025–2028) – US. 194
Fast Strategic Cues (2025). 195
Regulatory x Funding Heatmap – US. 195
Adjacency-Opportunity Radar – US. 196
Whitespace Partner-Fit Matrix – US. 196
Market Summary: Canada. 197
Key Market Dynamics. 197
Strategic Takeaways. 197
Top 3 Recommendations. 197
Market Overview – Canada. 198
Demographics & Epidemiology. 198
Imaging Supply & Utilization. 198
Health System & Practice Patterns. 198
Regulatory & Reimbursement. 198
AI-Imaging Market Dynamics. 199
Competitive Snapshot. 199
Key Implications. 199
Canadian Market by Clinical Area. 200
Forecast by Clinical Area (2023-2032, USD Mill). 200
Outlook by Clinical Area. 200
Key Dynamics to Watch. 200
Implications for Vendors. 201
Canadian Market by Imaging Modality. 201
Forecast by Imaging Modality (2023-2032, USD Mill). 201
Outlook by Modality. 201
Key Dynamics to Watch (2025-27). 202
Implications for Vendors. 202
Canadian Market by Revenue Stream.. 203
Forecast by Revenue Stream (2023-2032, USD Mill). 203
What’s Driving Each Revenue Stream.. 203
Key Dynamics to Watch. 203
Implications for Vendors. 203
Canadian Market by Clinical Application. 204
Forecast by Clinical Application (2023-2032, USD Mill). 204
Outlook & Drivers by Application. 204
Key Market Dynamics to 2027. 205
Implications for Vendors and Providers. 205
Canadian Market by End-Use Organization. 205
Forecast by End-Use Organization (2023-2032, USD Mill). 205
Outlook 2025-2032. 206
Key Drivers by Segment. 206
Implications for Vendors. 206
Strategic Takeaways. 206
Canadian Market by AI Technology. 207
Forecast by AI Technology (2023-2032, USD Mill). 207
Highlights by Technology. 207
Key Dynamics to Watch (2025‑27). 208
Implications for Vendors & Providers. 208
GTM at a Glance – Canada. 209
GTM Readiness Radar – Canada. 209
Tiered Customer Landscape. 209
Channel & Pricing Matrix. 210
GTM Timeline (Canada). 210
Fast Cues for 2025 Stakeholders. 210
Market Overview & Analysis. 211
Market Snapshot. 211
Structural Demand Signals. 211
Regulatory & Funding Landscape (2024-2028). 211
Market Segmentation 2032 (value share). 211
Competitive Heat Map (2024-26). 212
Execution Playbook (2024-2027). 212
Action-Oriented Recommendations. 212
European Market Estimates and Forecasts by Country (2023-2032, USD Mill). 213
Five Forces Shaping Adoption. 213
Country Archetypes & What Sells. 213
Near‑term Adoption Runway (2024-27). 213
Strategic Implications. 214
Regulatory Velocity by Company – Europe. 214
Markintel Growth Maturity Matrix – Europe. 215
Landscape Snapshot. 215
Why the Quadrant Looks the Way it Does. 216
Key Competitive Dynamics. 216
Strategic Takeaways. 216
Bottom Line. 217
M&A Watchlist – Europe. 217
Competitive Dataset – Europe. 217
Growth & Maturity Highlights – Europe. 218
Markintel Ecosystem Collaboration Matrix (ECM) – Europe. 219
Quadrant Commentary & European Illustrations. 220
Action Checklist. 220
Markintel Solution Adoption & Growth Matrix – Europe. 221
Quadrant Deep Dive. 221
What Moves a Solution from One Box to the Next?. 222
Strategic Guidance. 222
AI Attach Rate – Europe. 223
OEM AI Attach Rate. 223
Attach Rate Trends – Europe. 223
AI Revenue Split – Factory vs Retrofit Attach — Europe. 224
GTM at a Glance – Europe. 224
Channel & Pricing Matrix (2025-2028). 224
GTM Readiness Radar — Europe. 225
Tiered Customer Landscape (2032 View). 226
GTM Timeline (2025 → 2028) – Europe. 226
Adjacency Opportunity Radar (2026+) – Europe. 227
Regulatory x Funding Heatmap – Europe. 227
AI Imaging Whitespace Matrix – Europe. 228
Fast Strategic Cues (2025 playbook). 228
Market Overview – Germany. 229
Macro & Epidemiology. 229
Health‑system & Funding Landscape. 229
Regulatory & Evidence Pathway. 229
Competitive Landscape. 229
Strategic Takeaways & Recommendations. 230
German Market by Clinical Area. 230
Forecast by Clinical Area (2023-2032, USD Mill). 230
Primary Growth Catalysts. 230
Strategic Messages for Stakeholders. 231
Key Takeaways. 231
German Market by Modality (2023-2032, USD Million). 231
Forecast by Modality (2023-2032, USD Mill). 231
Key Inflection by Modality. 232
What’s Driving Each Modality. 232
Strategic Implications. 232
German Market by Revenue Stream (2023-2032, USD Million). 233
Forecast by Revenue Stream (2023-2032, USD Mill). 233
Revenue Streams and Drivers. 233
Key Dynamics by Stream.. 233
Strategic Guidance. 234
German Market by Clinical Application (2023-2032, USD Million). 234
Forecast by Clinical Application (2023-2032, USD Mill). 234
What is Driving Each Bucket. 235
Strategic Messages. 235
Action Playbook. 235
German Market by End-Use Organization (2023-2032, USD Million). 236
Forecast by End-Use Organization (2023-2032, USD Mill). 236
Segments Review.. 236
Strategic Implications. 236
German Market by AI Technology (2023-2032, USD Million). 237
Forecast by AI Technology (2023-2032, USD Mill). 237
Germany – AI Imaging Market by Core Technology. 237
Why Deep Learning Keeps the Lion’s Share. 237
Break-out Growth Themes. 238
Strategic Playbook. 238
GTM at-a-Glance. 238
Channel x Pricing Matrix. 238
GTM Readiness Radar — Germany. 239
Tiered Customer Landscape. 239
GTM Timeline – Germany. 240
Fast Strategic Cues. 240
Market Summary: France. 241
Top‑line Snapshot – France. 241
Key Market Dynamics. 241
Strategic Takeaways. 241
Top 3 Recommendations. 242
French Market Speed scan – Market Analysis (2024‑2032). 242
French Market Estimates and Forecasts (2023-2032). 243
French Market by Clinical Area (2023-2032). 243
French Market by Modality (2023-2032). 244
French Market by Revenue Stream (2023-2032). 244
French Market by Clinical Application (2023-2032). 245
French Market by End-Use Organization (2023-2032). 245
French Market by AI Technology (2023-2032). 246
Quick Strategic Cues – France GTM… 246
GTM at a Glance – France. 247
Channel x Pricing Matrix. 247
GTM Readiness Radar — What Counts Most in France. 247
GTM Timeline (2024‑30) – France. 248
Spend Potential by Customer Tier – France. 248
Market Overview – United Kingdom.. 249
UK Market Speed Scan. 250
UK Market Estimates and Forecasts (2023-2032). 251
UK Market by Clinical Area (2023-2032). 251
UK Market by Modality (2023-2032). 251
UK Market by Revenue Stream (2023-2032). 252
UK Market by Clinical Application (2023-2032). 252
UK Market by End-Use Organization (2023-2032). 253
UK Market by AI Technology (2023-2032). 254
GTM at a Glance – UK. 254
Channel x Pricing Matrix. 254
GTM Readiness Radar – UK. 255
Fast Strategic Cues. 255
Tiered Customer Landscape. 256
GTM Timeline (2024‑29) – UK. 256
Market Overview & Summary: Italy. 257
What Makes Italy Unique in the EU Context. 258
Strategic Takeaways. 258
Italian Market Estimates & Forecasts (2023-2032). 258
Italian Market by Clinical Area (2023-2032). 258
Italian by Modality (2023-2032). 259
Italian Market by Revenue Stream (2023-2032). 259
Italian Market by Clinical Application (2023-2032). 260
Italian Market by End-Use Organization (2023-2032). 260
Italian Market by AI Technology (2023-2032). 261
GTM at a Glance – Italy. 261
Market Overview & Summary – Spain. 264
Strategic Takeaways. 264
Spanish Market Estimates and Forecasts (2023-2032). 265
Spanish Market by Clinical Area (2023-2032). 265
Spanish Market by Modality (2023-2032). 265
Spanish Market by Clinical Application (2023-2032). 266
Spanish Market by Revenue Stream (2023-2032). 266
Spanish Market by End-Use Organization (2023-2032). 267
Spanish Market by AI Technology (2023-2032). 267
GTM at a Glance – Spain. 268
GTM Readiness Radar – Spain. 268
Channel x Pricing Matrix. 268
Tiered Customer Landscape – Spain. 269
GTM Timeline – Spain. 269
Market Overview: Rest of Europe (ROE). 270
Strategic Takeaways. 270
Rest of European Market for AI in Medical Imaging (2023-2032). 271
Rest of European Market by Clinical Area (2023-2032). 271
Rest of European Market by Modality (2023-2032). 271
Rest of European Market by Revenue Stream (2023-2032). 272
Rest of European Market by Clinical Application (2023-2032). 272
Rest of European Market by End-Use Organization (2023-2032). 273
Rest of European Market by AI Technology (2023-2032). 273
GTM at a Glance – Rest of Europe (ROE). 274
GTM Readiness Radar – ROE. 274
Tiered Customer Landscape – ROE. 275
GTM Timeline – ROE. 275
Channel × Pricing Matrix. 275
Adjacency-Opportunity Matrix (2026-2030). 275
Country‑Cluster Framework & Strategic Playbook. 276
White-Space Partnership Matrix. 276
Regulatory Funding Heatmap (ROE Clusters). 277
Fast Strategic Cues. 277
Size, Trajectory & Strategic Importance. 278
Demand Drivers & Headwinds. 278
Competitive & Partnership Landscape. 278
Strategic Clustering & Go-to-Market Nuances. 279
Strategic Recommendations. 279
AI Imaging Market by Country – APAC. 279
Markintel GTM Growth and Maturity Matrix – APAC. 280
Competitive Data Set – APAC. 280
Numbers-in-Context – APAC. 282
Strategic Takeaways – APAC. 282
Growth & Maturity Highlights – APAC. 282
M&A Watchlist – APAC. 283
Regulatory Velocity – APAC. 283
OEM AI Attach Rate – APAC. 284
Attach‐Rate Trends – APAC. 285
GTM at a Glance – APAC. 286
GTM Readiness Radar – APAC. 286
Tiered Customer Landscape – APAC. 286
GTM Timeline – APAC. 287
Adjacency Opportunity Matrix – APAC. 287
Country-Cluster Framework – APAC. 287
White Space Partner Framework – APAC. 288
Regulatory Funding Heatmap – APAC. 289
Channel x Pricing Matrix – APAC. 289
Fast Strategic Cues – APAC. 289
China – Market Overview & Strategic Summary (2023‑2032). 290
Strategic Takeaways. 290
Chinese Market Forecasts (2023-2032). 291
Chinese Market by Clinical Area (2023-2032). 291
Chinese Market by Modality (2023-2032). 292
Chinese Market by Revenue Stream (2023-2032). 292
Chinese Market by Clinical Application (2023-2032). 293
Chinese Market by End-Use Organization (2023-2032). 294
Chinese Market by AI Technology (2023-2032). 294
Markintel Growth Maturity Matrix – China AI in Medical Imaging. 295
Executive Commentary. 296
Cross-Quadrant Insights & Tactical Guidance. 297
Priority Recommendations (next 18 months). 297
Competitive Dataset – China. 297
Markintel Ecosystem Collaboration Matrix – China. 298
Decoding the 2 × 2 and Turning it into Action. 299
Three Rules for Winning the Collaboration Game. 299
Quick‑hit Actions for BD teams (Next Two Quarters). 299
Markintel Solution Adoption and Growth Matrix – China. 300
Translating the Matrix into Action. 301
Execution Priorities by Function. 301
“First‑100-Days” Checklist. 302
Metrics that Matter. 302
Operating Roadmap Takeaway. 302
GTM at a Glance – China. 303
GTM Readiness Radar – China. 303
Tiered Customer Landscape – China. 303
GTM Timeline – China. 304
Adjacency-Opportunity Radar – China. 304
Regulatory Funding Heatmap – China. 305
Channel × Pricing Matrix – China. 305
White Space Partnership Matrix – China. 306
Market Overview & Strategic Summary: Japan. 307
Strategic Outlook. 307
Action Points. 307
Japanese Market Forecasts (2023-2032). 308
Japanese Market by Clinical Area (2023-2032). 308
Japanese Market by Modality (2023-2032). 308
Japanese Market by Revenue Stream (2023-2032). 309
Japanese Market by Clinical Application (2023-2032). 309
Japanese Market by End-Use Organization (2023-2032). 310
Japanese Market by AI Technology (2023-2032). 310
Markintel Solution Adoption & Growth Matrix – Japan. 311
Turning the Matrix into an Operating Road‑Map for Japan (2024‑28). 311
Markintel Ecosystem Collaboration Matrix – Japan. 312
Turning the Matrix into an Operating Roadmap. 313
Playbook Highlights by Quadrant. 313
Risk Checkpoints & Mitigations. 314
Go-to-Market (GTM) Playbook – Japan. 315
GTM Readiness Radar – Japan. 315
Tiered Customer Landscape – Japan. 315
GTM Timeline – Japan. 316
Adjacency Opportunity Radar – Japan. 316
Regulatory Funding Heatmap – Japan. 317
Channel x Pricing Matrix – Japan. 317
White Space Partnership Matrix – Japan. 318
Fast Strategic Cues. 318
Market Overview & Analysis. 319
Executive Snapshot. 319
Market Mechanics. 319
Constraint Map. 319
Competitive Temperature (“5 P” quick lens). 320
Actionable Opportunities (2024-26 Window). 320
Go‑Forward Recommendations (by player type). 320
What Success Looks Like. 320
Indian Market Forecasts (2023-2032). 321
Indian Market by Clinical Area (2023-2032). 321
Indian Market by Modality (2023-2032). 321
Indian Market by Revenue Stream (2023-2032). 322
Indian Market by Clinical Application (2023-2032). 322
Indian Market by End-Use Organization (2023-2032). 323
Indian Market by AI Technology (2023-2032). 323
Markintel Solution Adoption & Growth Matrix – India. 324
Solution Classes and Action Cues. 324
Strategic Interpretation & Operating Roadmap. 325
One-Page Operating Checklist. 326
Markintel Ecosystem Collaboration Matrix – India. 326
Operating Roadmap: Leveraging India’s Collaboration Matrix. 327
Strategic Sequencing (2024‑27). 328
Execution Tips. 328
Key Metrics to Track. 328
Competitive Landscape – India. 328
Key Competitive Insights. 330
Operating Roadmap. 330
GTM at a Glance – India. 331
GTM Readiness Radar – India. 331
Tiered Customer Landscape – India. 331
GTM Timeline – India. 332
Adjacency-Opportunity Radar – India. 332
Regulatory x Funding Heatmap – India. 333
White-Space Partnership Matrix. 333
Channel × Pricing Matrix. 333
Fast Strategic Cues (Do‑This‑First). 333
Market Summary: South Korea. 334
Key Market Dynamics. 334
Strategic Takeaways. 334
Top 3 Recommendations. 335
South Korean Market Forecasts (2023-2032). 337
South Korean Market by Clinical Area (2023-2032). 337
South Korean Market by Modality (2023-2032). 337
South Korean Market by Revenue Stream (2023-2032). 338
South Korean Market by Clinical Application (2023-2032). 338
South Korean Market by End-Use Organization Type (2023-2032). 339
South Korean Market by AI Technology (2023-2032). 339
GTM at a Glance – South Korea. 340
Six-Pillar GTM Readiness Radar – South Korea. 340
Tiered Customer Landscape – South Korea. 340
Five-Step GTM Timeline – South Korea. 341
Adjacency-Opportunity Radar – South Korea. 341
Regulatory x Funding Heatmap – South Korea. 342
Whitespace Partnership Matrix – South Korea. 342
Channel × Pricing Matrix – Typical 2025 Deals. 342
Fast Strategic Cues. 343
Market Overview & Analysis. 344
Market Structure & Growth Drivers. 344
Segment Hotspots (Qualitative Sizing). 344
Competitive Landscape. 344
Strategic Implications & GTM Priorities. 345
Action-Oriented Recommendations (Next 12 Months). 345
Australian Market Forecasts (2023-2032). 346
Australian Market by Clinical Area (2023-2032). 346
Australian Market by Modality (2023-2032). 346
Australian Market by Revenue Stream (2023-2032). 347
Australian Market by Clinical Application (2023-2032). 348
Australian Market by End-Use Organization (2023-2032). 348
Australian Market by AI Technology (2023-2032). 349
GTM at a Glance – Australia. 350
GTM Readiness Radar – Australia. 350
GTM Timeline – Australia. 350
Adjacency-Opportunity Radar – Australia. 351
Regulatory x Funding Heatmap. 351
Market Overview & Analysis. 352
Regional Clusters. 352
Market Dynamics ― What’s Shaping Buying Decisions. 352
Actionable Recommendations. 353
Quick-Hit Opportunities by Cluster. 353
What Success Looks Like. 354
Rest of Asia-Pacific Market Forecasts (2023-2032). 354
Rest of Asia-Pacific (ROAPAC) Market by Clinical Area (2023-2032). 354
Rest of Asia-Pacific (ROAPAC) Market by Modality (2023-2032). 355
Rest of Asia-Pacific (ROAPAC) Market by Revenue Stream (2023-2032). 355
Rest of Asia-Pacific (ROAPAC) Market by Clinical Application (2023-2032). 356
Rest of Asia-Pacific (ROAPAC) Market by End-Use Organization (2023-2032). 356
Rest of Asia-Pacific (ROAPAC) Market by AI Technology (2023-2032). 357
GTM at a Glance – ROAPAC. 357
GTM Readiness Heatmap – ROAPAC Clusters. 357
Five-Step GTM Roll‑Out Timeline (2024‑2029) – Keyed to Clusters. 358
Market Overview & Analysis: Latin America (LATAM). 359
Market Summary. 359
Growth Driver Waterfall – LATAM… 359
Geo‑Economic Clusters (for GTM focus). 359
Segment Trends to 2032. 360
Regulatory Snapshot (big‑5). 360
Action-Oriented Recommendations. 360
LATAM Market Estimates and Forecasts. 361
LATAM Market by Clinical Area (2023-2032). 361
LATAM Market by Modality (2023-2032). 362
LATAM Market by Revenue Stream (2023-2032). 362
LATAM Market by Clinical Application (2023-2032). 363
LATAM Market by End-Use Organization (2023-2032). 364
LATAM Market by AI Technology (2023-2032). 364
Markintel Solution Adoption & Growth Matrix – LATAM… 365
Cross‑Quadrant Operating Roadmap (2024‑27). 367
Markintel Ecosystem Collaboration Matrix – LATAM… 367
Operating Roadmap (90‑Day Focus). 368
GTM at-a-Glance – LATAM… 369
GTM Readiness Radar – LATAM… 369
GTM Timeline – LATAM… 369
LATAM Country Clusters Summary. 370
Cluster-Priority Heatmap. 370
Regulatory Velocity & Reimbursement Pulse – LATAM… 370
OEM AI Attach Rate – LATAM… 371
GTM Maturity Highlights by Company – LATAM… 371
Market Overview & Analysis: Middle East & Africa (MEA). 372
LATAM Snapshot. 372
Logical Clusters & Why They Matter. 372
Key Growth Catalysts. 372
Structural Barriers & Mitigation. 372
Actionable Recommendations by Vendor Type. 373
Sequencing Roadmap. 373
Executive Takeaways. 373
Middle East & Africa (MEA) – Market Estimates and Forecasts. 374
MEA Market by Clinical Area (2023-2032). 374
MEA Market by Modality (2023-2032). 374
MEA Market by Revenue Stream (2023-2032). 375
MEA Market by Clinical Application (2023-2032). 375
MEA Market by End-Use Organization (2023-2032). 376
MEA Market by AI Technology (2023-2032). 376
Markintel Solution Adoption & Growth Matrix – MEA.. 377
Interpretation & Operating Roadmap. 377
Execution Checklist. 378
Markintel Ecosystem Collaboration Matrix – MEA.. 379
Partnership Playbook. 379
Operating Roadmap & Key Execution Metrics. 380
GTM at-a-Glance – Middle East & Africa (MEA). 380
GTM Readiness Radar – MEA.. 380
Country Cluster Heatmap – MEA.. 381
GTM Timeline – Pilot‑to‑Scale (2024-2029) – MEA.. 381
Adjacency-Opportunity Radar – MEA.. 382
GTM Maturity Highlights. 382
Regulatory Velocity – MEA.. 383
Attach Rate Trends – MEA.. 383
Driving healthcare innovation through actionable intelligence, strategic execution, and transformative solutions for global impact and growth.