Individual License: $2,950 | Team and Enterprise License Options Available
Asia–Pacific (APAC) Oncology Imaging AI is forecast to grow from US$126.5M in 2023 to US$1.94B by 2032 (35.5% CAGR)—the fastest-growing major region globally, driven by scaled screening pathways, expanding oncology imaging infrastructure, and increasingly competitive domestic vendors and platforms. Breast and Lung/Chest are the largest pools; Prostate is a premium growth lane tied to MRI and therapy-linked imaging.
APAC Oncology Imaging AI Pulse 2025–2032 quantifies the regional market and provides country-level deep dives for key APAC economies, including China, Japan, India, Australia, South Korea, and Rest of APAC.
This Pulse is built to answer:
APAC is the global growth engine
The region’s growth is driven by scaled care pathways and rapid adoption of workflow solutions that can deploy across large networks.
Country strategy is not optional
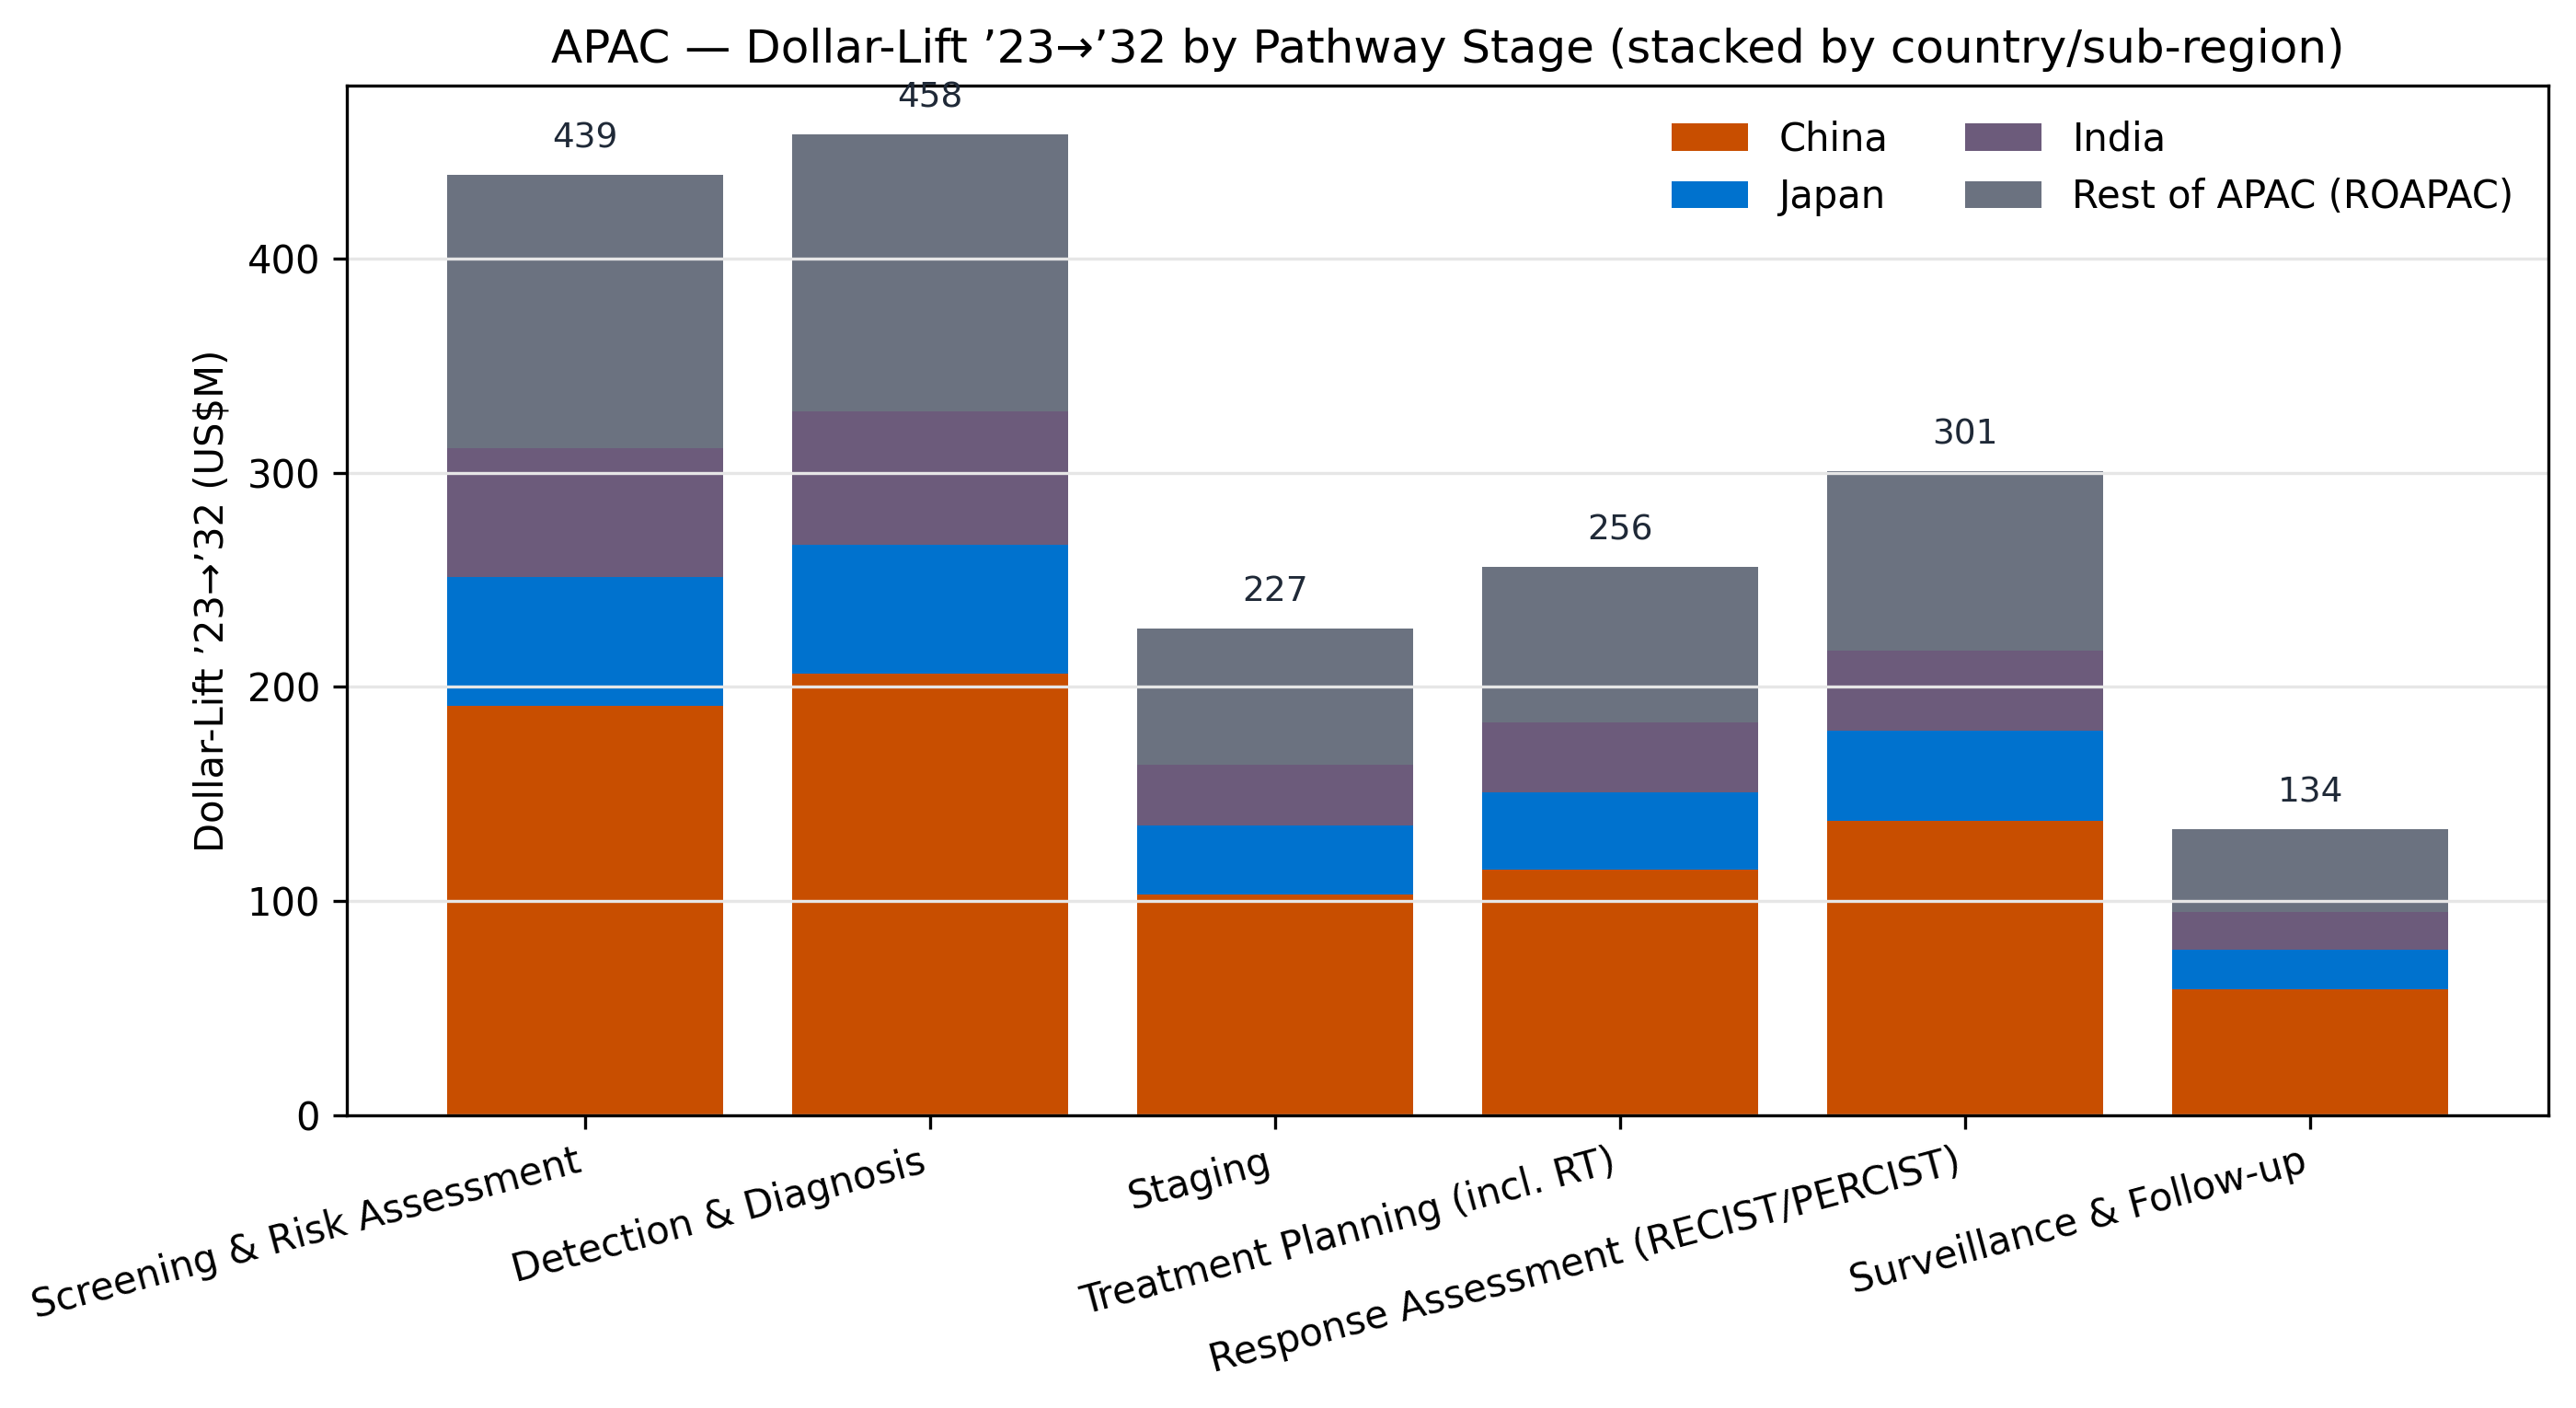
China drives scale; India delivers momentum; Japan provides stability and premium adoption lanes—each requires distinct GTM and partnership logic.
CT-led opportunity with DR/MRI backbone
CT anchors large-volume oncology pathways; DR (including mammography/DBT) remains a durable volume pool; MRI expands as quantification and staging workloads grow.
Quantification and orchestration are the expansion layer
As detection becomes more common, growth concentrates in measurement-grade analytics, structured reporting, and workflow orchestration across the oncology pathway.
Cloud/usage models expand with scaled deployment
Usage-based and cloud delivery gain relevance as screening hubs and multi-site networks expand—especially where rapid deployment and updates are commercially valued.
This Pulse emphasizes APAC’s commercial rails, including:
Use this Pulse to:
Q1) What is the APAC Oncology Imaging AI market size and growth outlook (2023–2032)?
A: APAC Oncology Imaging AI is forecast to grow from US$126.5M (2023) to ~US$1.94B (2032) at a 35.5% CAGR (nominal USD), making APAC the fastest-growing major region.
Q2) Which APAC countries drive the most Oncology Imaging AI spend?
A: By 2032, key country markets include China (~US$864M), Japan (~US$270M), India (~US$252M), and Rest of APAC (~US$286M).
Q3) Which modalities account for the largest APAC Oncology Imaging AI opportunity?
A: APAC’s largest 2032 modality pools are CT (~US$706M), X‑ray/DR incl. mammography/DBT (~US$491M), and MRI (~US$431M), followed by PET/Nuclear (~US$249M).
Q4) What are the main drivers of Oncology Imaging AI adoption in APAC?
A: APAC growth is supported by scaled screening and oncology pathway expansion, increasing imaging capacity, and the rise of domestic vendors and platforms that accelerate deployment and commercialization.
Q5) Does the APAC Pulse include country-level analysis, or only a regional view?
A: It includes both: a regional APAC outlook plus country chapters covering China, Japan, India, and Rest of APAC, with segmentation and forecasts.
Q6) Who should use the APAC Oncology Imaging AI Pulse report?
A: The report is designed for corporate strategy, product/portfolio, commercial/GTM, partnership teams, and investors seeking a quantitative baseline and segmentation-driven view of where APAC oncology imaging AI growth concentrates.