Global Nuclear Medicine & PET Market Horizon Report: Market Structure, Forecasts, Competitive Dynamics, Theranostics, and AI / Workflow Monetization, 2025A–2036E - August 2026

Individual License: $4,950 | Team and Enterprise License Options Available


This Marketstrat® Horizon report provides an in-depth global analysis of Nuclear Medicine imaging and the broader PET, SPECT, radiopharmaceutical, theranostics, isotope, software, and provider-capacity ecosystem.


It is built for molecular-imaging OEM executives, radiopharmaceutical companies, isotope and manufacturing suppliers, nuclear-pharmacy and distribution organizations, software and dosimetry platforms, corporate strategy and development teams, investors, providers, and commercial leaders with exposure to Nuclear Medicine.


The report integrates equipment systems, active installed base, replacement and expansion shipments, realized ASPs, service and aftermarket, diagnostic radiopharmaceuticals, therapeutic product curves, medical-isotope and manufacturing readiness, reimbursement, productive treatment-site capacity, and separately monetized AI and workflow into one reconciled decision model.


Many market studies separate equipment demand from radiopharmaceutical products or treat clinical opportunity as though it converts directly into revenue. This report analyzes the two principal economic pillars of Nuclear Medicine, equipment and radiopharmaceuticals, while preserving the distinct economics of service, software, isotope supply, distribution, reimbursement, and provider operations.


The central question is:

Where will value accumulate as Nuclear Medicine shifts from a scanner-centered modality to an integrated diagnostic, therapeutic, supply, workflow, and provider-capacity operating system?

The report was developed through Markintel®, Marketstrat’s proprietary research methodology, strategic framework stack, and evidence-to-insight workflow. The analysis combines a bottom-up global market model with regulatory, clinical, reimbursement, company, procurement, manufacturing, infrastructure, and provider-operating evidence.
 

Market Snapshot

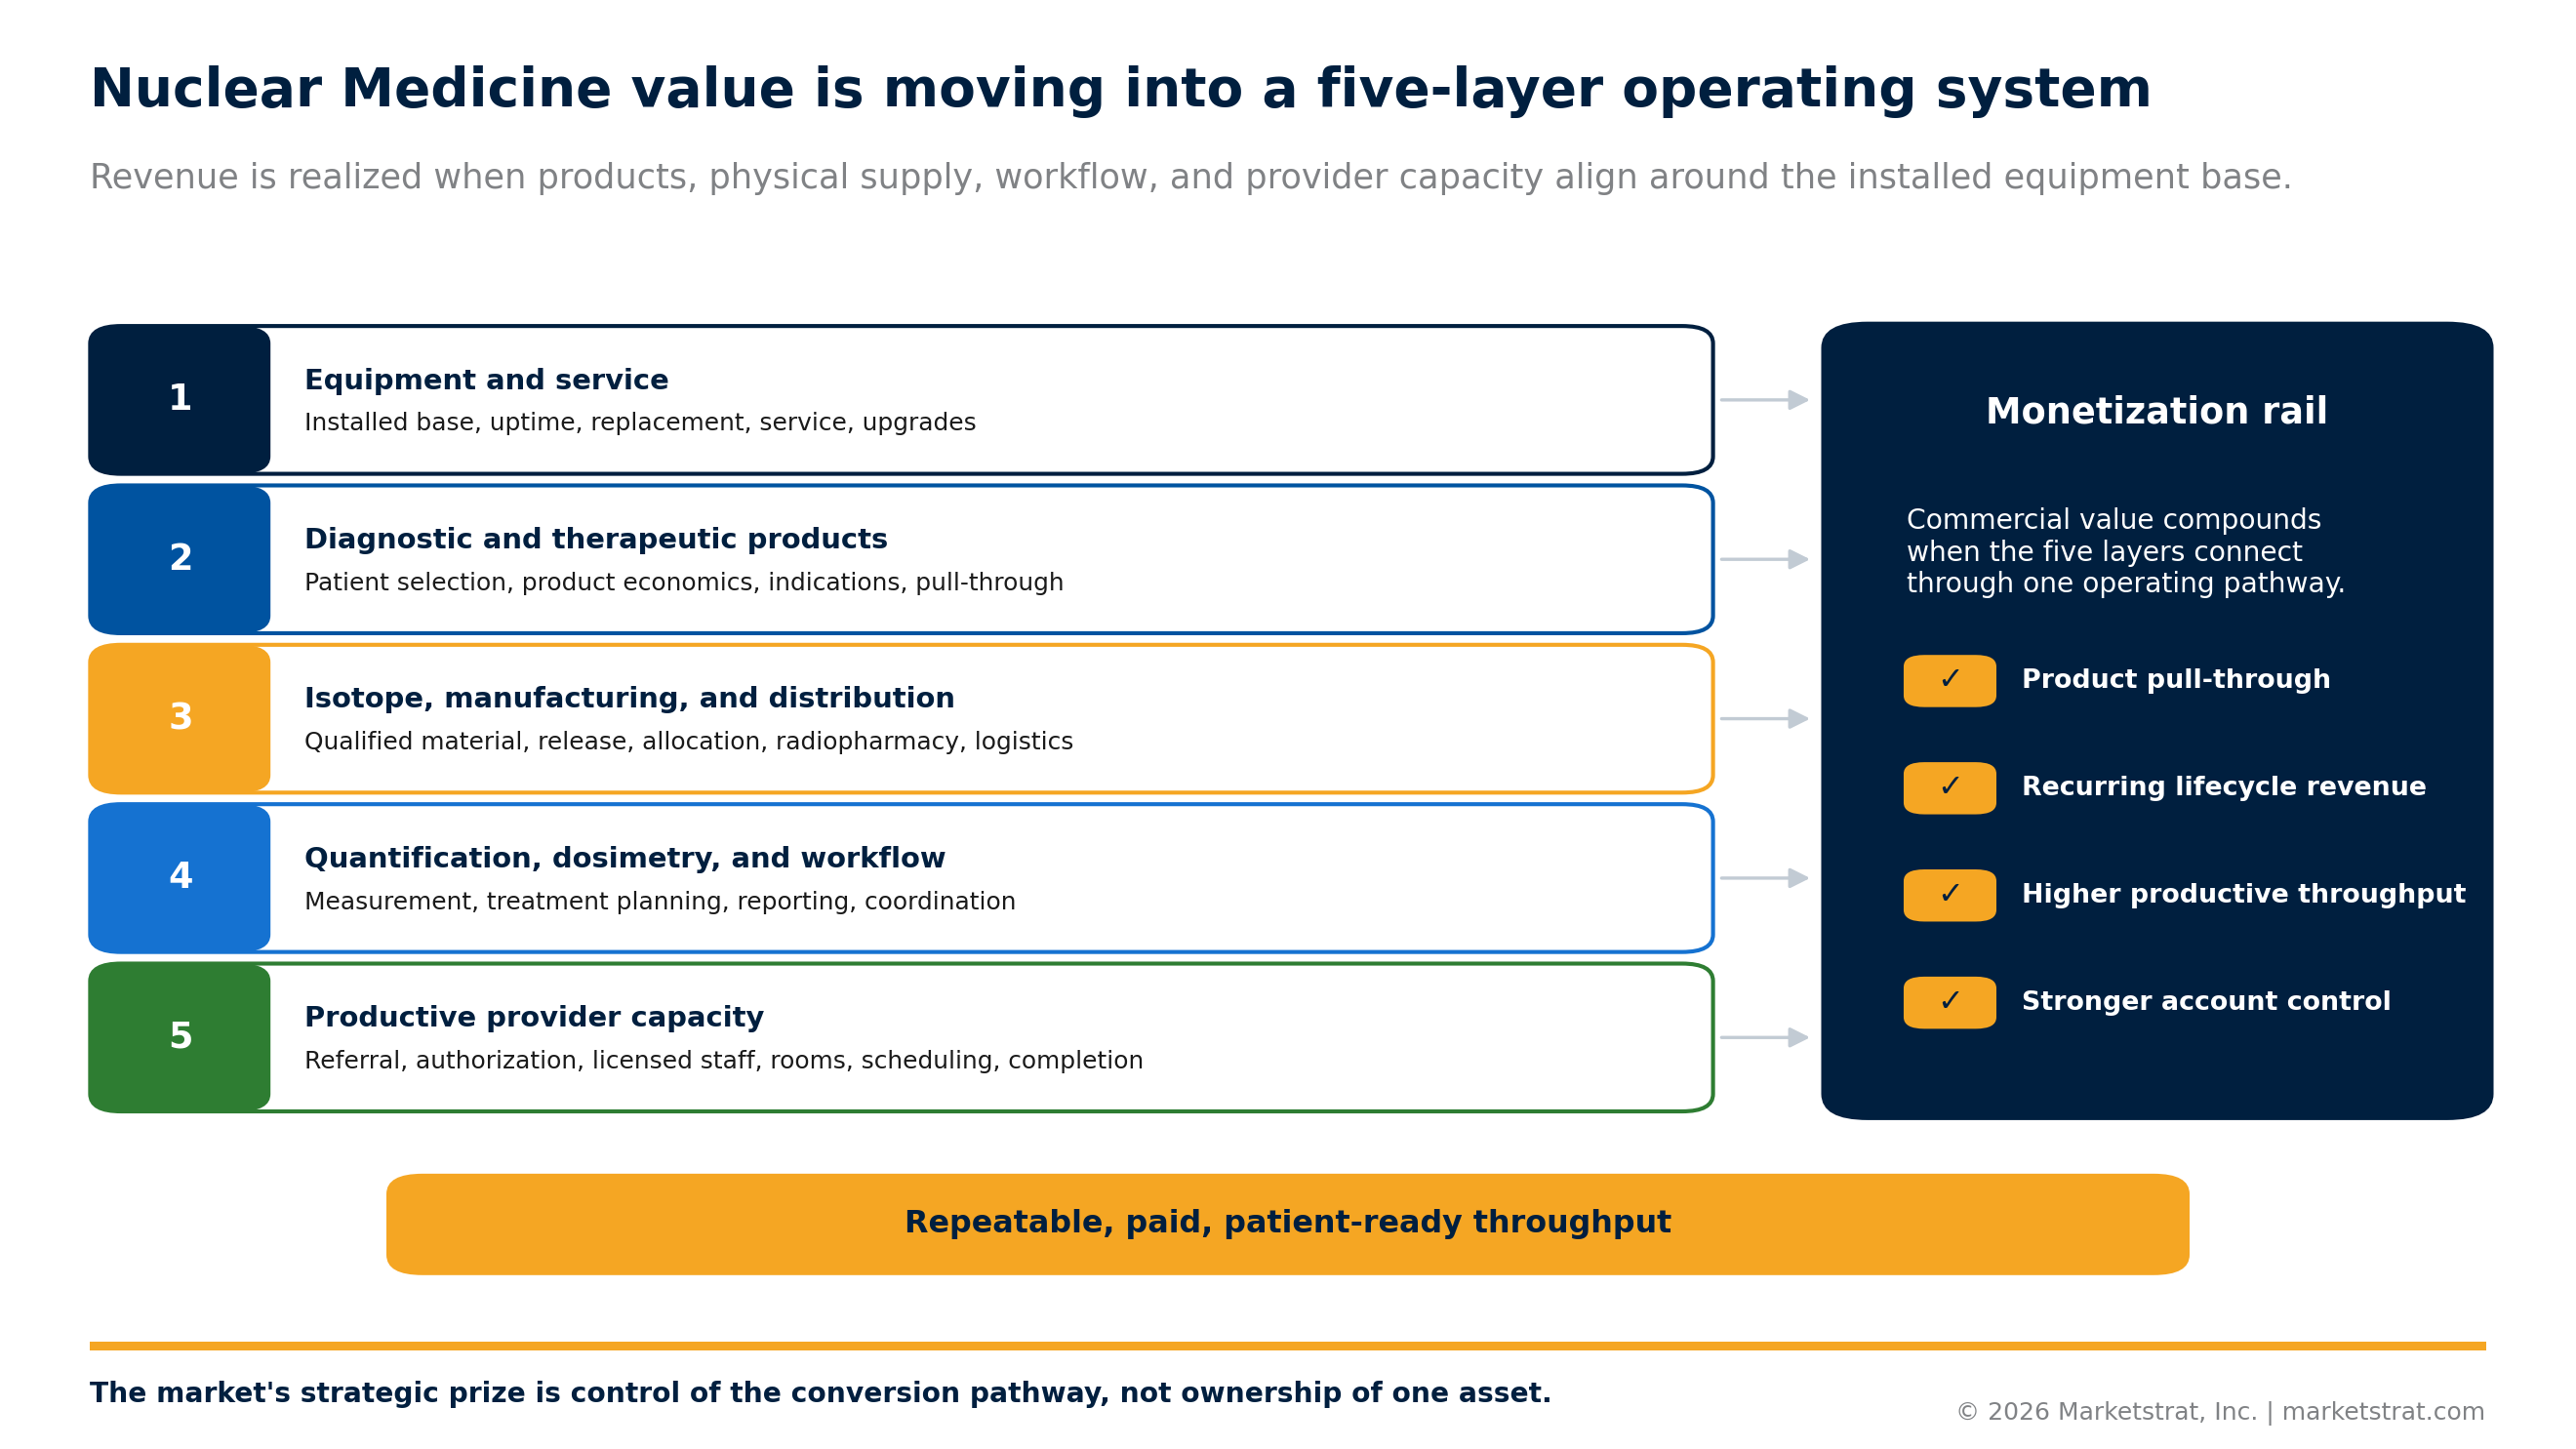
Nuclear Medicine is moving from a modality-centered equipment market toward an integrated diagnostic and therapeutic operating system.


Marketstrat estimates that the core Nuclear Medicine ecosystem increases from US$16.2 billion in 2025A to US$29.4 billion in 2036E, representing a 5.6% CAGR.


Radiopharmaceuticals drive approximately 75% of total market growth. Diagnostic radiopharmaceuticals remain the largest revenue layer, while therapeutic radiopharmaceuticals become the principal growth engine.


Equipment remains the access platform. Digital PET/CT, long-axial-field-of-view PET, PET/MR, and SPECT/CT gain strategic weight as the fleet becomes more digital, hybrid, quantitative, and connected to specialty clinical pathways. Service, software, and upgrades increase the lifetime value of the installed base.


The market does not follow one uniform growth path.


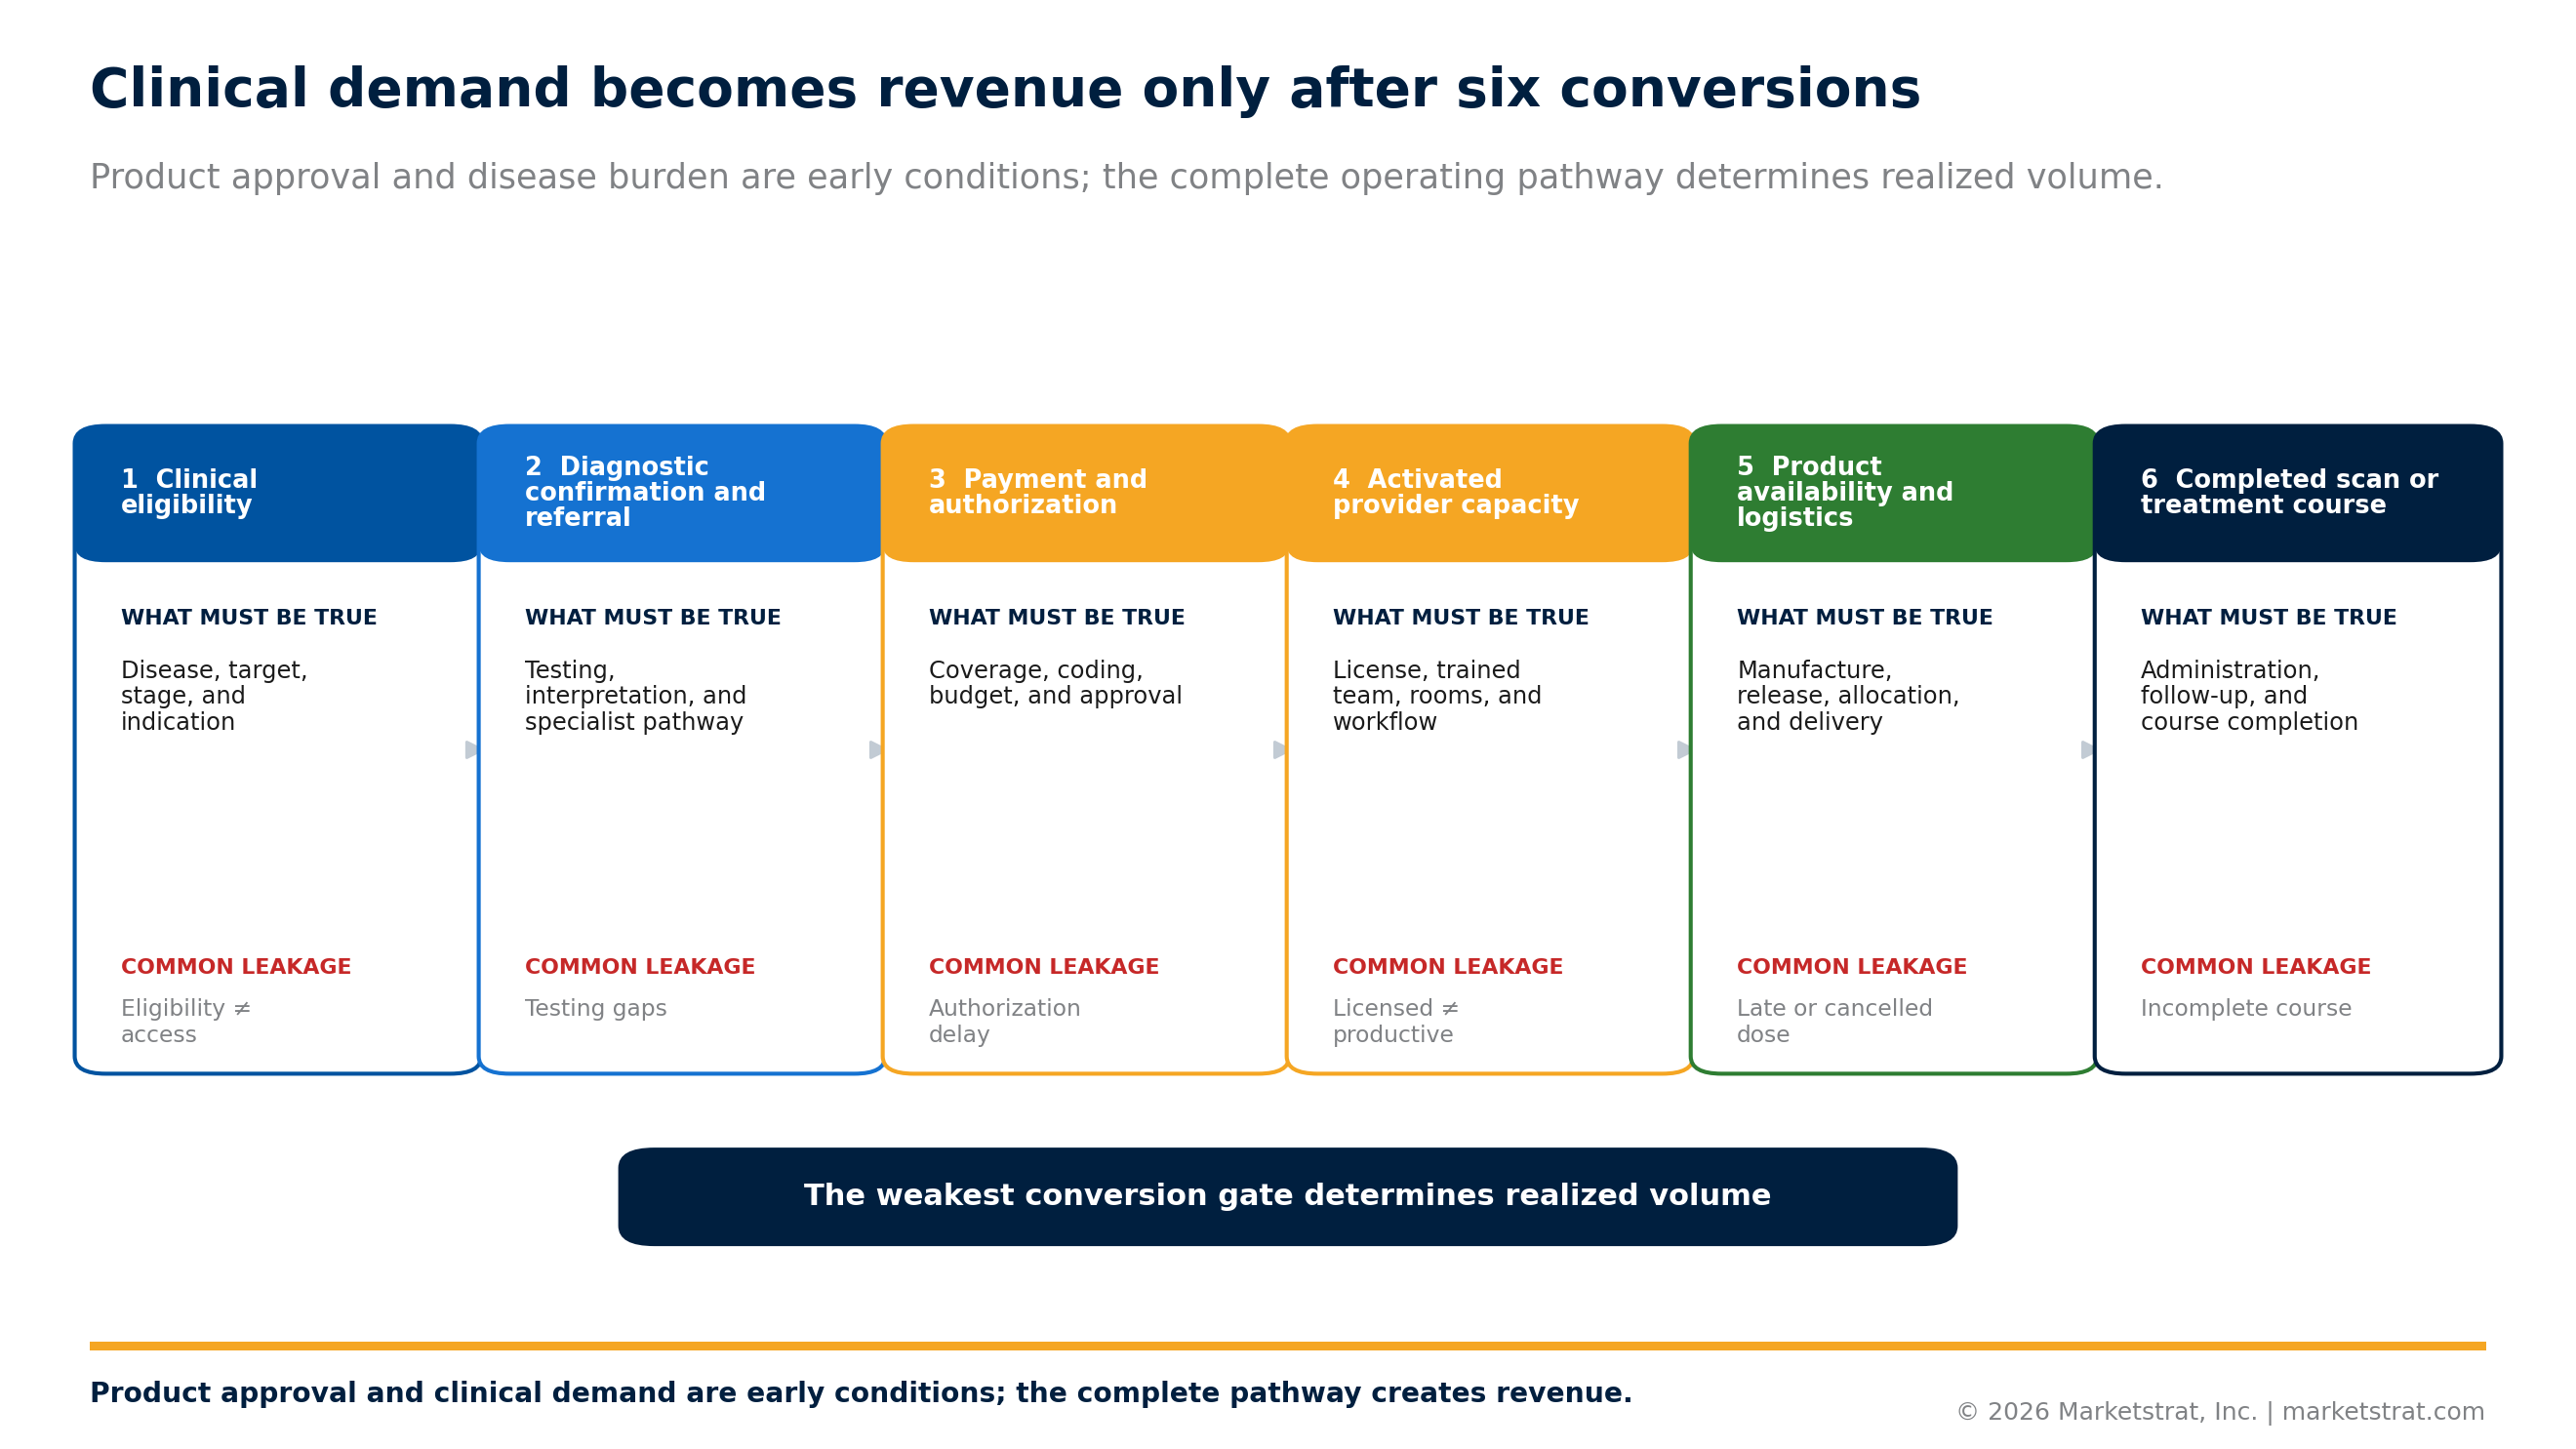
Mature diagnostic categories such as Tc-99m and FDG retain scale. PSMA, cardiac, neuro, and specialty PET create new product and workflow opportunities. Radioligand therapy expands the therapeutic market but requires qualified isotope, product-specific manufacturing, distribution, reimbursement, licensed staff, treatment rooms, scheduling, and course completion.


North America remains the largest commercial market. Europe retains a large installed and clinical base. China, India, and Rest of Asia-Pacific gain share through different combinations of equipment expansion, local production, public procurement, private oncology investment, reimbursement, and provider development.

Clinical momentum creates the opportunity. Product supply, payment, and productive provider capacity determine how much of that opportunity becomes revenue.

Structural Market Shifts: What Is Changing

Theranostics is shifting the market’s center of gravity

Radioligand therapy links diagnostic selection, medical isotopes, drug-product manufacturing, distribution, provider activation, dosimetry, and longitudinal follow-up. Commercial advantage increasingly depends on the ability to manage the complete pathway.

Diagnostic radiopharmaceuticals remain the largest revenue pool

The diagnostic market is broad and durable, but internal growth is changing. Cardiac, neuro, PSMA, and specialty PET gain weight, while established Tc-99m and FDG pathways continue to support procedure volume, installed equipment, service, and regional radiopharmacy networks.

Digital PET is changing premium equipment competition

Digital PET/CT expands through replacement, dose efficiency, throughput, quantitative consistency, and specialty pathway demand. LAFOV and total-body PET influence premium competition before they become large installed-base categories.

SPECT remains strategically important

SPECT-only systems decline in mix, but the active SPECT fleet remains large. SPECT/CT gains relevance through hybrid replacement, cardiology, quantitative imaging, theranostics, and dosimetry.

Medical-isotope capacity must be assessed by stage

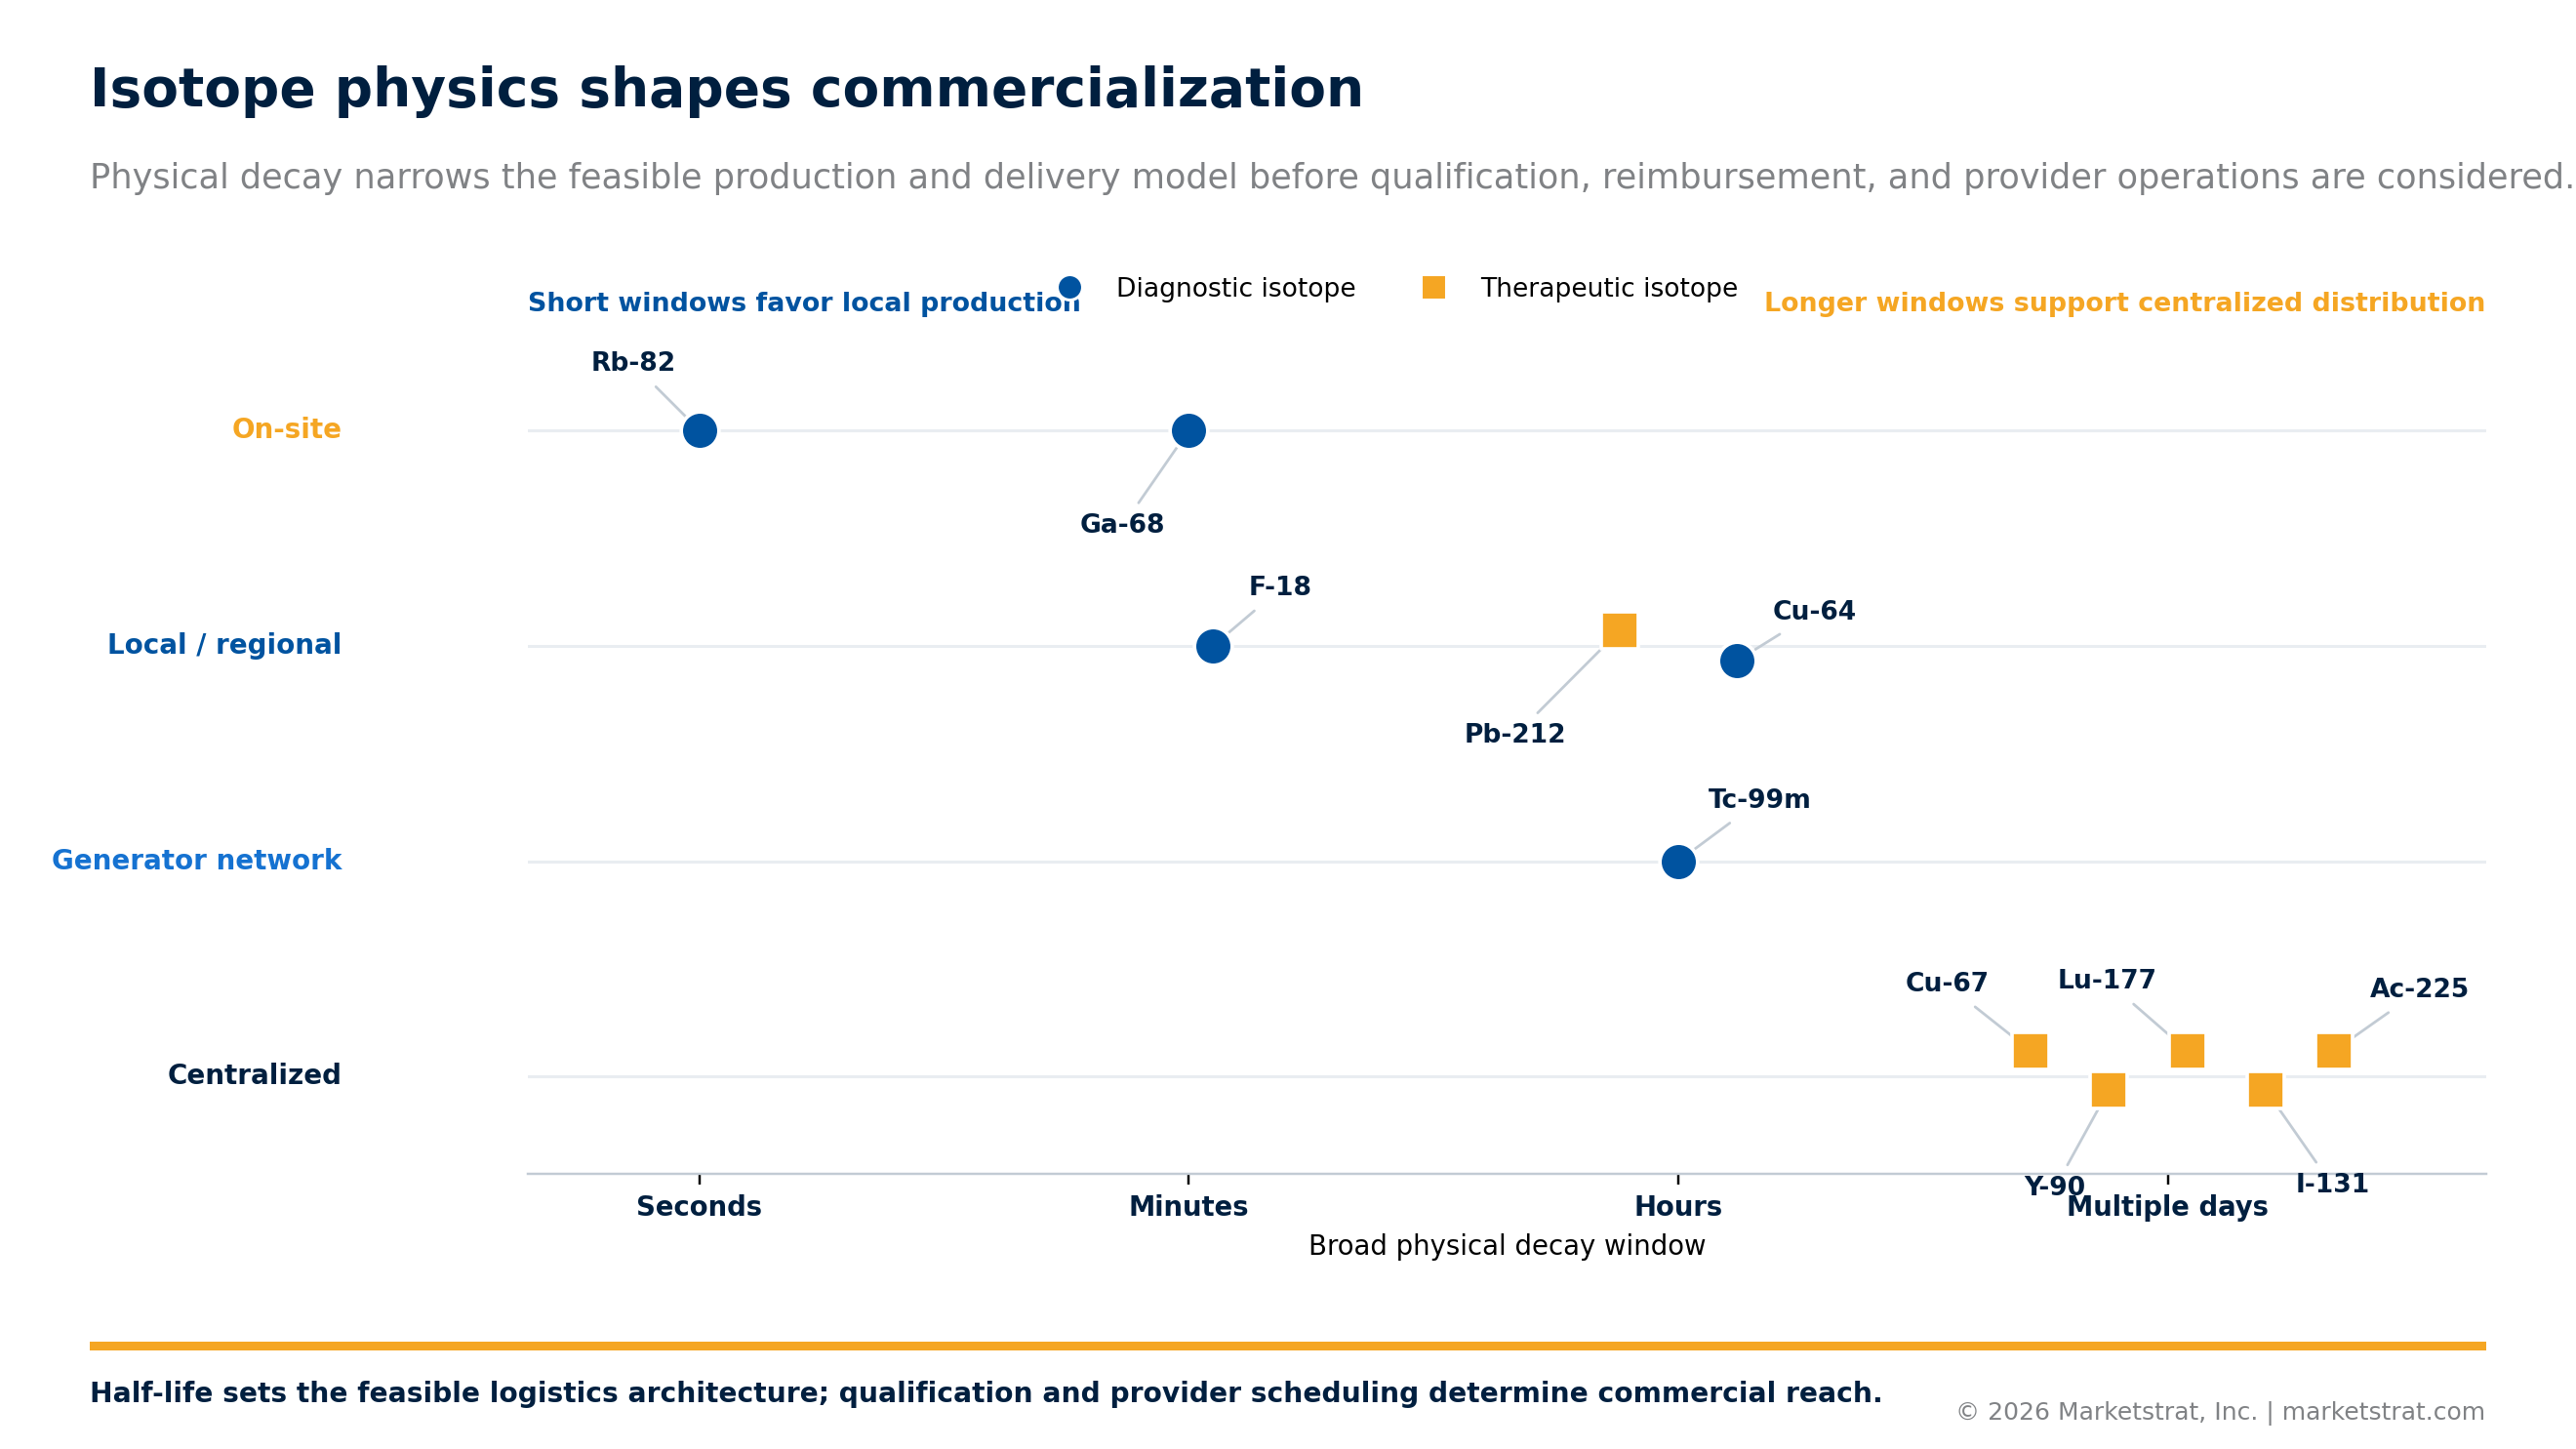
Announced production is not equivalent to qualified and delivered supply. The report distinguishes announced, constructed, licensed, operating, customer-qualified, allocated, released, delivered, and administered capacity.

Provider capacity becomes a binding commercial constraint

A contracted or licensed treatment site does not automatically represent productive capacity. Workforce, authorized users, rooms, payer authorization, dose scheduling, radiation safety, and repeated treatment-course commitments determine throughput.

AI monetization is concentrated in defined use cases

The strongest opportunities are in reconstruction, oncology quantification, theranostics dosimetry, cardiac and neuro analysis, reporting, trial analytics, remote review, and operational coordination. Embedded scanner software and separately monetized vendor software are treated differently.

Regional opportunity is revenue-layer specific

An attractive equipment market may have limited radiopharmaceutical access. A strong diagnostic market may have limited therapy capacity. Country strategy must reflect product registration, reimbursement, local production, distribution, service, workforce, and provider readiness.
Competitive Architecture: Who Controls the Nuclear Medicine Pathway?

Marketstrat organizes the competitive market into eight strategic clusters:


  • Integrated molecular-imaging OEMs and software stacks
  • Diagnostic radiopharmaceutical franchises
  • Therapeutic radiopharma and theranostics companies
  • Isotope, generator, CDMO, and distribution infrastructure
  • Quantification, dosimetry, and image-enhancement specialists
  • Enterprise workflow, reporting, and orchestration platforms
  • Provider networks, mobile access, and theranostics centers
  • Life-sciences, trial-imaging, and radiopharma-QC software


Representative companies covered include GE HealthCare; Siemens Healthineers; United Imaging Healthcare; Philips; Mediso; Spectrum Dynamics Medical; Lantheus, pending acquisition by Curium; Telix Pharmaceuticals; Novartis; Eli Lilly / POINT Biopharma; Bristol Myers Squibb / RayzeBio; AstraZeneca / Fusion Pharmaceuticals; ITM / Lumara Bio; Clarity Pharmaceuticals; Perspective Therapeutics; Curium; Cardinal Health; Eckert & Ziegler; SHINE Technologies; Jubilant Pharmova; Nucleus RadioPharma; BWX Technologies; NorthStar Medical Radioisotopes; TerraPower Isotopes; Nusano; AdvanCell; Hermes Medical Solutions; Subtle Medical; AIQ Solutions; Sectra; Visage Imaging / Pro Medicus; LabLogic; and Elysia-Raytest.


Within each cluster, the report examines:

  • The relevant revenue denominator
  • Where commercial control sits
  • Product and technology maturity
  • Installed-base and distribution advantages
  • Isotope, manufacturing, and provider dependencies
  • Geographic position
  • Partnership and acquisition logic
  • Primary execution risks
  • Signals to monitor over the next 12–24 months


The report does not force all competitors into one blended market-share table. Equipment share, diagnostic product share, therapeutic product share, isotope control, software adoption, distribution reach, and provider access are separate competitive measures.

Methodology and Markintel® Strategic Frameworks

The report was developed through Markintel®, Marketstrat’s proprietary market-intelligence methodology and framework system.


The research architecture combines:

  • A reconciled bottom-up global market model
  • Equipment revenue, shipments, installed-base, replacement, technology-mix, ASP, and service analysis
  • Manufacturer-net diagnostic radiopharmaceutical category forecasts
  • Product- and cohort-level therapeutic radiopharmaceutical curves
  • Narrow vendor-net AI, quantification, dosimetry, and workflow analysis
  • Medical-isotope, cyclotron, generator, CDMO, radiopharmacy, and distribution evidence
  • Reimbursement, coding, payment, and provider-operating analysis
  • Country and regional market structures
  • Base, Bull, and Bear scenarios
  • Regulatory databases and national health-system sources
  • Company filings and announcements
  • Procurement and tender evidence
  • Clinical literature and professional-society materials
  • Licensed commercial and expert evidence
  • Marketstrat estimates and strategic analysis


Plus Marketstrat and Markintel frameworks

What the Report Covers

Global market and forecast architecture
  • Core global market model, 2025A–2036E
  • Base, Bull, and Bear scenarios
  • Revenue-layer growth and value migration
  • Market sensitivities and forecast triggers
  • Denominator definitions and double-counting controls
Equipment, installed base, and service
  • PET/CT legacy and digital SiPM systems
  • LAFOV and total-body PET/CT
  • PET/MR
  • SPECT/CT
  • SPECT-only and gamma-camera systems
  • Active installed base
  • Replacement and expansion shipments
  • Realized ASPs and technology mix
  • Service, upgrades, parts, training, and lifecycle value
Diagnostic and therapeutic radiopharmaceuticals
  • Tc-99m and established SPECT products
  • FDG and oncology PET
  • PSMA PET
  • SSTR imaging
  • Cardiac PET tracers
  • Amyloid, tau, and other neuro PET
  • Specialty PET products
  • Commercial radioligand therapies
  • Late-stage therapeutic product cohorts
  • Lu-177, Ac-225, Pb-212, Cu-67, Y-90, I-131, and related isotope strategies
  • Product launch, indication, competition, erosion, and post-peak assumptions
Enabling ecosystem and provider capacity
  • Mo-99 / Tc-99m generators
  • Cyclotrons and regional production
  • Medical-isotope supply
  • CDMO and drug-product manufacturing
  • Radiopharmacy and distribution
  • Product release and delivery
  • Reimbursement and coding
  • Provider licensing and authorized users
  • Workforce and treatment rooms
  • Site activation and course completion
  • Dosimetry, reporting, and workflow
Competitive, regional, and strategic analysis
  • Eight competitive clusters
  • Company spotlights
  • Competitive control points
  • Therapeutic pipeline
  • Product and platform positioning
  • Regional forecasts
  • Country market context
  • Commercial archetypes
  • Stakeholder priorities
  • 12–36 month action agenda
  • Signals that would change the forecast

Intended Audience: Who This Report Helps

Molecular-imaging OEMs

Use the report to assess digital PET and SPECT/CT replacement, LAFOV timing, PET/MR positioning, service attachment, quantitative software, installed-base strategy, regional product mix, and partnerships with radiopharmaceutical and workflow companies.

Diagnostic radiopharmaceutical companies

Evaluate category growth, tracer mix, manufacturer-net economics, reimbursement, product differentiation, distribution access, scanner availability, referral pathways, competitive share, and opportunities in PSMA, cardiac, neuro, and specialty PET.

Therapeutic radiopharma companies

Test product curves, launch timing, indication potential, isotope and manufacturing readiness, distribution, patient finding, treatment-site activation, productive capacity, course completion, competitive entry, and post-peak behavior.

Isotope producers, CDMOs, and radiopharmacy networks

Understand which isotope and product pathways are likely to create demand, which forms of capacity are commercially usable, where redundancy is needed, and how customer qualification, allocation, release, logistics, and regional access influence value.

AI, dosimetry, and workflow vendors

Identify the use cases with a credible paid model, the buyers most likely to adopt them, the difference between embedded and separately monetized software, and the integration, evidence, reimbursement, and operating requirements for commercial conversion.

Providers and health systems

Use the operating-capacity frameworks to assess scanner utilization, tracer access, treatment-room requirements, authorized staffing, scheduling, reimbursement, radiation safety, course management, dosimetry, and the economics of building or expanding a Nuclear Medicine program.

Corporate strategy and corporate development teams

Evaluate market-entry assumptions, adjacent revenue pools, partnership needs, transaction logic, product concentration, infrastructure dependencies, regional priorities, and companies that control strategic bottlenecks.

Investors, private equity, banks, and advisory firms

Separate clinical potential from commercial readiness. Test market denominators, product curves, manufacturing claims, productive-site capacity, competitive control, scenario risk, recurring revenue, and the difference between visible product sales and infrastructure influence.

Government and public-sector programs

Assess equipment access, isotope resilience, domestic production, regional distribution, reimbursement, workforce, provider capacity, procurement, and the conditions required to convert clinical need into productive national infrastructure.

Report Details

  • Title: Global Nuclear Medicine & PET Market Horizon
  • Subtitle: Market Structure, Forecasts, Competitive Dynamics, Theranostics, and AI / Workflow Monetization, 2025A–2036E
  • Type: Markintel® Horizon Report, Flagship In-Depth Market Intelligence
  • Publication: August 2026
  • Report ID: [MINTH-02103]
  • Forecast Period: 2025A–2036E
  • Length: Approximately 178 pages
  • Content: 81 numbered tables and 33 figures, including proprietary Marketstrat and Markintel strategic frameworks
  • Format: PDF digital delivery
  • Regional Coverage: North America; Europe; China; Japan and South Korea; India; Rest of Asia-Pacific; Latin America; Middle East and Africa
  • Detailed Country Coverage: United States, Canada, Germany, France, United Kingdom, Italy, Spain, China, Japan, South Korea, India, Australia / New Zealand, Brazil, Mexico, Saudi Arabia / UAE, and South Africa
  • Licensing: Individual, Team, and Enterprise options
  • Price: Individual $4,950 | Team $5,450 | Enterprise $8,950
By submitting this form, you agree to our Privacy Policy