Individual License: $2,950 | Team and Enterprise License Options Available
The global oncology segment of medical imaging AI grows from US$ 604.7M in 2023 to US$ 7.74B in 2032, a 32.7% CAGR, making it one of the fastest-expanding pools in imaging AI.
Oncology Imaging AI Strategy Pulse 2025–2032: Pathways, Platforms & Playbooks is Marketstrat’s global deep-dive on how cancer imaging AI is actually being bought, deployed, and scaled across health systems, OEMs, and pharma.
The report positions oncology as the reference use case for medical imaging AI—where enterprise buyers are defining budgets, governance rules, platform choices, and evidence standards that will spill over into every other AI-imaging domain.
Built on Marketstrat’s Markintel™ framework stack, the report combines:
- A 2023–2032 global market forecast for oncology imaging AI
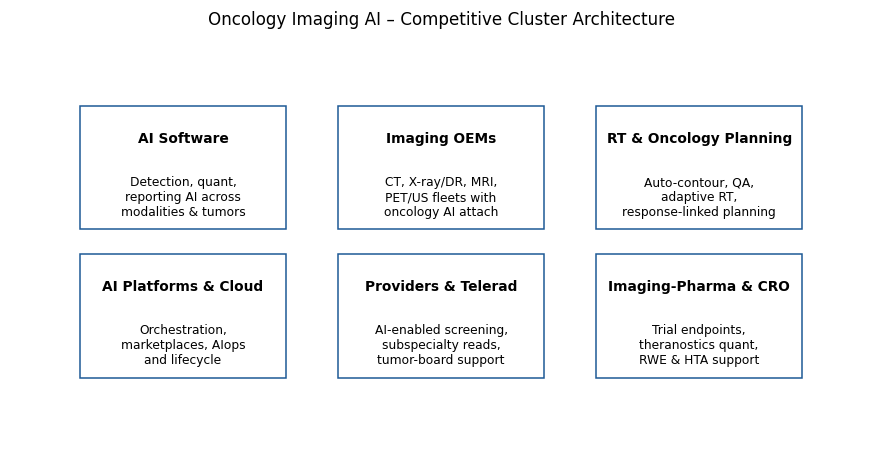
- Competitive architecture across six vendor clusters (AI software, OEMs, RT, platforms, providers/telerad, imaging‑pharma/CRO)
- Actionable GTM and packaging playbooks using proprietary matrices (M³, ARC, GTM Growth–Maturity, Upgrade & Package Ladders)
The result is a strategy-grade view designed for executives in imaging AI, oncology IT, radiology, RT, pharma, private equity, and health systems who need more than high-level TAM numbers. If your organization is deciding where to play, how to win, and how to package in oncology imaging AI between now and 2032, this report is designed to be the strategic baseline you build on.
Key Market Trends
1. From single-use CAD to pathway-centric, measurement-first AI
- Spend is shifting from isolated detection apps to measurement-centric workflows: segmentation, volumetrics, RECIST/PERCIST tools, radiomics, PET dosimetry, and structured reporting.
- Detection & diagnosis remains foundational, but Quantification & Analytics and Reporting & Communication gain share as tumor boards and payers demand reproducible metrics, not just “AI flags.”
2. Screening programs as durable AI budget anchors
- National and regional breast DBT and LDCT lung screening initiatives in the US, Europe, China, Japan, and selected middle‑income markets are embedding AI into operating models (triage, second reads, QA, centralized reading).
- For vendors, oncology AI increasingly shows up as a line item in screening and RT program budgets, rather than experimental IT spend.
3. Theranostics & RT planning as high-value niches
- PSMA/SSTR theranostics and advanced PET/CT, combined with auto-contour and adaptive RT, create demand for multi‑timepoint quantitative AI.
- Oncology imaging AI becomes the measurement engine behind treatment planning, response tracking, and eventual value‑based oncology models.
4. Platformization, marketplaces, and governance
- PACS-integrated AI marketplaces, neutral AI platforms, and cloud orchestrators remove deployment friction and enable multi-vendor oncology suites under a single contract.
- Evidence, validation, and monitoring capabilities (AIops) are becoming explicit RFP criteria, not a nice‑to‑have.
5. APAC momentum and global equity gaps
- APAC’s growth rate now exceeds Europe’s, driven by state-backed screening and domestic OEMs/platforms.
- At the same time, adoption remains uneven in LATAM and MEA, where cloud-first, PPU and teleradiology models are emerging to bridge access gaps.
6. Regulatory velocity as a competitive moat
- Vendors with a steady cadence of oncology-relevant FDA, CE/MDR, and local approvals are winning more enterprise tenders and payer pilots.
- Marketstrat’s ARC-Index (Approvals, Reimbursement, Clinical validation) quantifies this gap by use case and cluster.
Competitive Landscape
The report maps the oncology imaging AI landscape into six tightly defined clusters, each with its own economics, rails, and GTM logic:
AI Software Vendors
- Breast DBT, CT-lung, PET response analytics, radiomics, tumor-board reporting.
- Prime Drivers: breast DBT suites, CT-lung triage & management.
Imaging OEMs (CT/MR/PET/DBT/US)
- Factory and retrofit attach on oncology packs (DBT+AI, CT-lung, PET quant, recon/dose AI, PCCT oncology).
- Control hardware attach-rate and scanner-level bundling.
RT & Oncology Planning Vendors
- Autocontour, Plan QA, Adaptive RT, response-linked planning, dose accumulation.
- Value realized at per-room level with tight TPS/linac integration.
AI Platforms & Cloud Providers
- Neutral marketplaces, orchestration layers, governed AIops platforms delivering one-contract deployment and monitoring.
Providers & Teleradiology Networks
- AI-assisted screening, oncology reads, tumor-board support, and network QA; convert app‑level value into service‑line revenue and outcomes.
Imaging‑Pharma / CRO & Trials Players
- Radiomics and quantitative endpoints, theranostics quant, lesion-level response analytics, RWE and HTA support.
Within each cluster, the report provides:
- Markintel M³ (Market Momentum Matrix) – showing segments in four quadrants
- GTM Growth–Maturity Matrices – showing market position of companies by cluster.
- Competitive Datasets & Scoreboards – vendor roles, channels, evidence posture, regions of strength.
This gives strategists a clear view of where to partner, where to compete, and where to buy or build.
Why This Report
1. Built for strategy, not just market sizing
Most AI market reports stop at “how big is the TAM.” This report is designed for board, C‑suite, and BU‑level decisions in oncology imaging AI. It links numbers directly to:
- Portfolio choices (which modalities, tumor sites, and pathway stages to prioritize)
- Platform and partnership strategy (OEMs, RT, platforms, providers, pharma)
- Pricing, packaging, and upgrade ladders aligned to evidence and readiness
2. Explicitly pathway‑ and attach‑rate‑driven
Oncology imaging AI uplifts do not come from scanner unit growth—they come from attach‑rate expansion and pathway adoption (screening, RT, theranostics, response monitoring). The model explicitly reconstructs revenue via:
- Installed base and exam volumes by modality and country
- Factory and retrofit attach-rates for oncology AI modules
- ASP/ARPU bands by revenue stream and end‑use
This makes the forecasts more useful for OEMs, software vendors, and platforms that live in attach‑rate math—not just high‑level CIO dashboards.
3. Actionable frameworks for GTM and packaging
The Markintel framework stack turns data into concrete, testable plays:
- M³ Market Momentum Matrix
- ARC-Index tells you which use cases are deployment-ready vs pilot‑stage.
- GTM Growth–Maturity matrices identify partners, M&A targets, and competitors by cluster.
- Upgrade & Package Ladders show how to package oncology AI into Foundation / Advanced / Elite offerings with embedded commercial rules.
This is particularly valuable for:
- Product & portfolio leaders – deciding where to invest, sunset, or bundle.
- GTM, commercial, and pricing teams – defining SKUs, floors, and discount structures.
- Investors and BD/M&A – identifying platforms and clusters with structural momentum.
4. Evidence-weighted and vendor‑agnostic
The analysis is evidence-weighted, not hype-led, and spans both incumbents and challengers across regions. It provides:
- Neutral, structured coverage of leading and emerging vendors in each cluster.
- Clearly labeled Evidence Confidence levels for placements and ARC scores.
- A methodology that can be revisited and extended as new data, trials, and approvals come online.
5. Designed to be reused
Tables, charts, and frameworks are crafted so they can be dropped directly into internal decks, investment committees, BD memos, and board packs with minimal rework, helping teams:
- Explain complex oncology AI dynamics to non‑technical stakeholders.
- Justify budgets and strategic bets with quantified, segmented evidence.
- Align product, sales, and partnership roadmaps around the same view of the market.
Companies Mentioned
5C Network; Accuray; Aidoc; AIQ Solutions; Bracco; Brainlab; Canon Medical; CARPL.ai; deepc (deepcOS); DocPanel; Elekta; Everlight Radiology; Ferrum Health; Fujifilm Healthcare; GE HealthCare; Guerbet; Hologic; Incepto; Koios Medical; Lantheus / EXINI (aPROMISE / PYLARIFY AI); Limbus AI; Lunit; Median Technologies; MIM Software; Mirada Medical; MVision AI; Nuance Precision Imaging Network (PIN); Philips Healthcare; Quibim; QView Medical; RadNet / DeepHealth; RaySearch Laboratories; Riverain Technologies; Samsung Healthcare; ScreenPoint Medical (Transpara); Siemens Healthineers; Teleradiology Solutions; Tempus (Arterys); Therapixel (MammoScreen); Unilabs / Telemedicine Clinic (TMC); United Imaging; Vara; vRad.
The list is cluster‑balanced—it includes AI software specialists, modality OEMs, RT/TPS vendors, platform players, provider/telerad networks, and imaging‑pharma/iCROs that feature in the oncology analysis.
Report Stats
- No. of Pages: 102
- Companies Mentioned: 42
- No. of Figures: 30
- Price: Individual License: $2,950 | Team License: $3,450 | Enterprise License $3,950
- SKU: MINTP-M01119-1